Quick Answer (TL;DR)
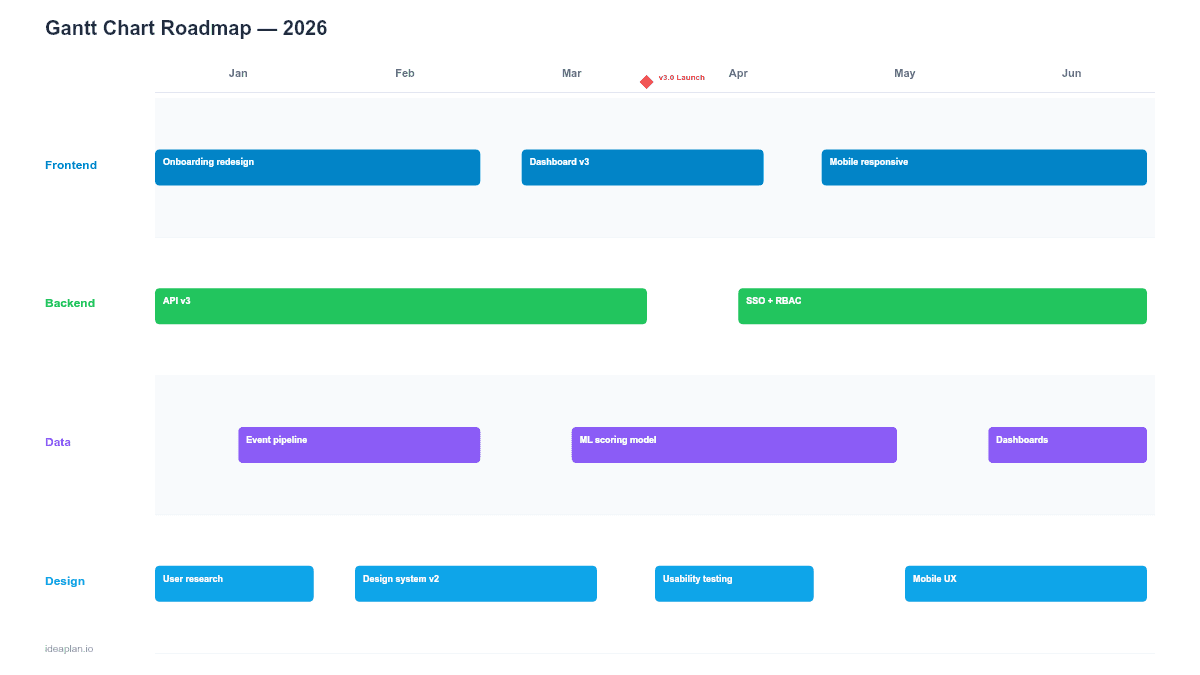
This free PowerPoint Gantt chart template displays product initiatives as horizontal bars on a weekly timeline grid. Each bar shows start date, end date, team owner, and completion percentage. Milestone diamonds mark key deadlines. Download the .pptx, replace the sample tasks, and use it for stakeholder updates where timing precision matters.
What This Template Includes
- Cover slide. Project or product name, timeline range, and last-updated date.
- Instructions slide. How to add tasks, adjust bar lengths, set milestones, and show dependencies. Remove before presenting.
- Blank template slide. Twelve task rows across a 16-week grid with alternating row shading. Columns for task name, owner, start, end, and status.
- Filled example slide. A product launch timeline with 10 tasks across four workstreams (design, engineering, QA, marketing), three milestone markers, and dependency arrows connecting sequential tasks.
When Gantt Charts Work Well
Gantt charts excel in situations with fixed deadlines and known dependencies. If you are coordinating a product launch with a hard date, managing a platform migration with sequential phases, or reporting to stakeholders who expect week-level precision, the Gantt format communicates clearly.
The visual power of a Gantt chart is in overlaps and gaps. When two bars run in parallel, the team sees concurrent work that may need coordination. When a gap appears between a predecessor and successor task, the team sees slack time. Or an unrealistic schedule if the gap is negative.
For teams building a product roadmap for the first time, the Gantt chart is often the most intuitive format because it maps directly to calendar time.
When to Avoid Gantt Charts
Gantt charts imply precision. Every bar has a start date and end date down to the week. That precision becomes a liability when:
- Requirements are uncertain. If you are still in discovery, a Gantt chart forces you to commit to dates before you understand the problem. A now-next-later roadmap is better for early-stage planning.
- Scope is flexible. Agile teams that adjust scope within sprints will find Gantt charts constantly out of date. The overhead of maintaining accurate bars outweighs the communication benefit.
- The audience is non-technical. Executives who want the strategic view often find Gantt charts too detailed. A quarterly roadmap or strategy roadmap communicates better at that altitude.
Use the Gantt format when the project has defined scope, known dependencies, and a fixed delivery date. Otherwise, pick a less time-precise format.
Template Structure
Task Rows
Each row represents a task or initiative. The left columns show task name, assigned team or person, and date range. The right side displays the horizontal bar on the weekly grid. Bar length equals duration. Bar color indicates workstream or priority.
Keep the task list to 10-15 items on a single slide. If you have more, either group related tasks into higher-level initiatives or split into multiple slides by workstream.
Weekly Grid
Vertical gridlines mark each week. Month labels appear in the header row for orientation. The 16-week default covers a full quarter with a 4-week buffer. Adjust the grid density based on your planning horizon. Use monthly gridlines for roadmaps longer than 6 months.
Dependency Arrows
Arrows connect tasks that must happen in sequence. The template uses a simple finish-to-start pattern: Task B cannot begin until Task A finishes. PowerPoint's connector tool snaps to bar edges, making it easy to draw and maintain these links.
Limit dependency arrows to the critical path. If every task depends on every other task, the chart becomes unreadable and the plan is probably too tightly coupled.
Milestone Diamonds
Diamond markers sit on the timeline at key dates: launch day, demo deadline, regulatory submission, or customer commitment. Place milestones above the grid header so they are visible regardless of which task rows are in view.
How to Use This Template
1. List your tasks
Start with the major deliverables and break them into tasks that take 1-4 weeks each. Tasks shorter than a week are too granular for a Gantt chart; keep those in your project management tool.
2. Assign owners
Every bar needs a single owner. Not a team, not "engineering". A person. This creates accountability and makes it immediately clear who to talk to when a bar turns red.
3. Set dates and draw bars
Place bars on the weekly grid based on realistic estimates. Factor in dependencies: if the API must be complete before frontend integration begins, the frontend bar starts after the API bar ends.
4. Mark the critical path
Highlight the sequence of tasks where any delay pushes the final deadline. This is your critical path. Color these bars differently or add a bold border. The critical path is where your risk lives.
5. Add milestones
Place 2-4 milestones on the timeline. Each should represent an external commitment or a point of no return. Internal checkpoints belong in your sprint plan, not on the Gantt chart.
6. Update weekly
Move bars to reflect actual progress. Color-code by status: green (on track), amber (at risk), red (delayed). Show the original plan as a ghost bar behind the current bar so stakeholders can see slippage at a glance.
When to Use This Template
The Gantt chart PowerPoint template is the right choice for:
- Product launches with a fixed date and multiple parallel workstreams
- Platform migrations where phases must execute in sequence
- Compliance or regulatory projects with hard deadlines
- Client delivery projects where contractual milestones drive the schedule
- Engineering planning reviews where the audience expects week-level detail
For roadmaps focused on strategy rather than scheduling, the swimlane PowerPoint template shows team coordination without the date precision overhead.
Featured in
This template is featured in:
Key Takeaways
- Gantt charts provide week-level precision for projects with fixed deadlines and known dependencies.
- Limit task rows to 10-15 per slide for readability at presentation scale.
- Dependency arrows should trace the critical path, not connect every task.
- Update bars weekly and color-code by status to show progress and slippage.
- Reserve Gantt charts for execution-phase planning. Use lighter formats for strategy and discovery.
- Compatible with Google Slides, Keynote, and LibreOffice Impress. Upload the
.pptxto Google Drive to edit collaboratively in your browser.