Quick Answer (TL;DR)
This free PowerPoint template tracks AI data pipeline development across five stages: Data Collection, Labeling & Annotation, Preprocessing & Transformation, Feature Store, and Data Versioning. Each stage has initiative cards with data quality metrics, throughput targets, and cost estimates. Download the .pptx, audit your current data infrastructure against these five stages, and build a plan that turns scattered data sources into a reliable pipeline that ML teams can actually depend on for training and inference.
What This Template Includes
- Cover slide. Product name, ML data team, number of active data pipelines, and monthly data processing volume.
- Instructions slide. How to assess pipeline maturity, define data quality standards, and plan infrastructure investments. Remove before presenting.
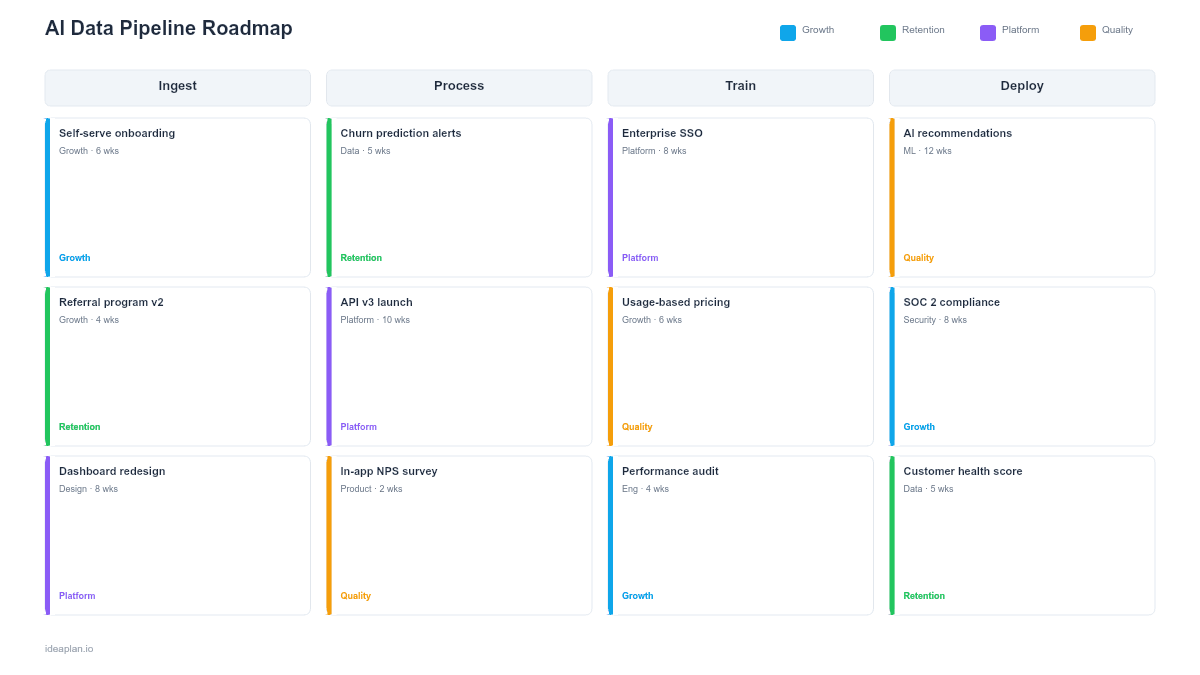
- Blank data pipeline roadmap slide. Five stages arranged left to right (Collection, Labeling, Preprocessing, Feature Store, Versioning) with initiative cards, throughput metrics, and quality gate indicators between stages.
- Filled example slide. A B2B SaaS product's data pipeline roadmap showing event stream ingestion for user behavior, crowd-sourced labeling workflow for support ticket classification, text preprocessing pipeline, production feature store with real-time and batch features, and DVC-based dataset versioning tied to model training runs.
Why AI Data Pipelines Need Their Own Roadmap
Every ML failure that looks like a modeling problem is actually a data problem. A recommendation model that returns irrelevant results usually has stale or incomplete user behavior data. A classification model with low accuracy typically has inconsistent labels or a training set that does not represent production traffic. A model that works in notebooks but fails in production almost always has a training-serving skew caused by different preprocessing logic in different environments.
Data pipeline work is invisible on standard product roadmaps. It does not ship a user-facing feature, so it competes poorly for engineering time against features that move metrics directly. But without reliable data pipelines, every model built on top of them is unreliable by inheritance. A model accuracy score can only be as good as the data that produces it.
The machine learning roadmap template tracks the full ML project lifecycle. This template zooms into the data layer that underpins it. The infrastructure that is hardest to build, most often neglected, and most consequential when it breaks.
Template Structure
Five Pipeline Stages
Left-to-right columns represent the data flow:
- Data Collection. Ingesting raw data from event streams, databases, APIs, user uploads, and third-party sources. Initiative cards track source reliability, ingestion latency, volume, and schema stability. The question: are we capturing the data our models need?
- Labeling & Annotation. Converting raw data into labeled training examples. Tracks labeling workflows (internal annotators, crowd-sourcing, model-assisted labeling), inter-annotator agreement scores, labeling throughput, and cost per label. The question: do we have enough high-quality labels?
- Preprocessing & Transformation. Cleaning, normalizing, tokenizing, embedding, and transforming raw data into model-ready formats. Tracks pipeline reliability, processing latency, and consistency between training and serving environments. The question: is the same preprocessing applied in training and production?
- Feature Store. Centralized storage for computed features available to both training jobs and real-time inference. Tracks feature freshness, serving latency, and feature coverage across models. The question: can models access computed features at training and inference time without duplicating logic?
- Data Versioning. Tracking which dataset version trained which model, enabling reproducibility, debugging, and regulatory audit trails. Tracks version coverage, lineage completeness, and storage costs. The question: can we reproduce any model's training data and trace any prediction to its inputs?
Initiative Cards
Each card contains:
- Initiative name. Specific pipeline work (e.g., "Build real-time user event stream for recommendation training").
- Data quality metric. Measurable standard (e.g., "99.5% schema compliance" or "Inter-annotator agreement > 0.85").
- Throughput target. Processing capacity goal (e.g., "10M events/day with < 5 min latency").
- Cost estimate. Monthly infrastructure and labor cost for this pipeline component.
- Downstream models. Which models depend on this pipeline stage.
Data Quality Dashboard
A bottom strip shows aggregate pipeline health: total data sources, percentage with automated quality checks, labeling backlog size, feature store coverage, and percentage of models with versioned training data. This gives leadership a portfolio view of data infrastructure maturity.
How to Use This Template
1. Map data dependencies for every model
For each ML model in production or development, trace its data flow backward: what features does it consume? Where do those features come from? What raw data feeds them? What labeling was required? This reveals the true dependency graph that your data pipeline must support. Most teams discover models sharing fragile data sources that nobody maintains.
2. Assess quality and reliability per stage
For each pipeline stage, measure current quality. Collection: what percentage of expected events arrive within SLA? Labeling: what is the inter-annotator agreement on your most recent batch? Preprocessing: does the training pipeline use identical logic to the serving pipeline? Feature store: how fresh are features at inference time? Versioning: can you reproduce last month's training dataset?
3. Prioritize by model impact and failure frequency
Invest first in the pipeline stages causing the most pain for the most models. If three models share a data source with 10% missing events, fixing collection reliability helps all three. If training-serving skew has caused two production incidents this quarter, preprocessing alignment is the priority. The AI risk assessment framework can help quantify the impact of data pipeline failures.
4. Build for training-serving consistency
The highest-value investment in most data pipelines is eliminating the gap between training and serving preprocessing. When training uses Python scripts and serving uses a different language or framework, bugs in the translation create skew that silently degrades model quality. Shared preprocessing code or a feature store that serves both training and inference eliminates this class of bugs.
5. Review biweekly with ML and data engineering
Data pipelines break in ways that are not immediately visible. A schema change in an upstream database might silently drop a column that a model depends on. A labeling vendor might shift annotation guidelines without notification. Biweekly reviews surface these issues before they propagate to model quality degradation. Track the retrieval precision metric for retrieval-based systems where data quality directly affects output quality.
When to Use This Template
An AI data pipeline roadmap is the right format when:
- Multiple ML models share data sources and preprocessing logic that needs coordinated development
- Data quality issues are the primary cause of model failures and production incidents
- Labeling is a bottleneck that constrains how fast new models can be built
- Training-serving skew has caused production quality degradation
- Regulatory requirements mandate data lineage and reproducibility for AI systems
For the full ML project lifecycle including model development and deployment, the machine learning roadmap template covers the broader scope. For data products that serve analytics and business intelligence alongside ML, the data product roadmap template addresses the wider data platform.
Featured in
This template is featured in AI and Machine Learning Roadmap Templates, a curated collection of roadmap templates for this use case.
Key Takeaways
- AI data pipelines span five stages: Collection, Labeling, Preprocessing, Feature Store, and Versioning.
- Most ML failures trace back to data problems. Stale sources, inconsistent labels, or training-serving skew.
- Training-serving preprocessing consistency is the highest-value investment for eliminating silent quality degradation.
- Labeling cost scales with model-assisted labeling, active learning, and synthetic data generation.
- Data versioning creates the audit trail needed for reproducibility, debugging, and regulatory compliance.
- Compatible with Google Slides, Keynote, and LibreOffice Impress. Upload the
.pptxto Google Drive to edit collaboratively in your browser.