Quick Answer (TL;DR)
This free PowerPoint innovation pipeline template tracks product ideas from initial concept through validation, development, and launch using a stage-gate funnel. Each stage has entry criteria, scoring rubrics, and explicit kill conditions so teams invest resources only in ideas that survive evidence checkpoints. Download the .pptx, load your idea backlog, and use it to give leadership visibility into what is being explored, what is being validated, and what is ready to build.
What This Template Includes
- Cover slide. Product or business unit name, innovation cycle, and pipeline owner.
- Instructions slide. How to submit ideas, score them at each gate, and apply kill criteria. Remove before presenting.
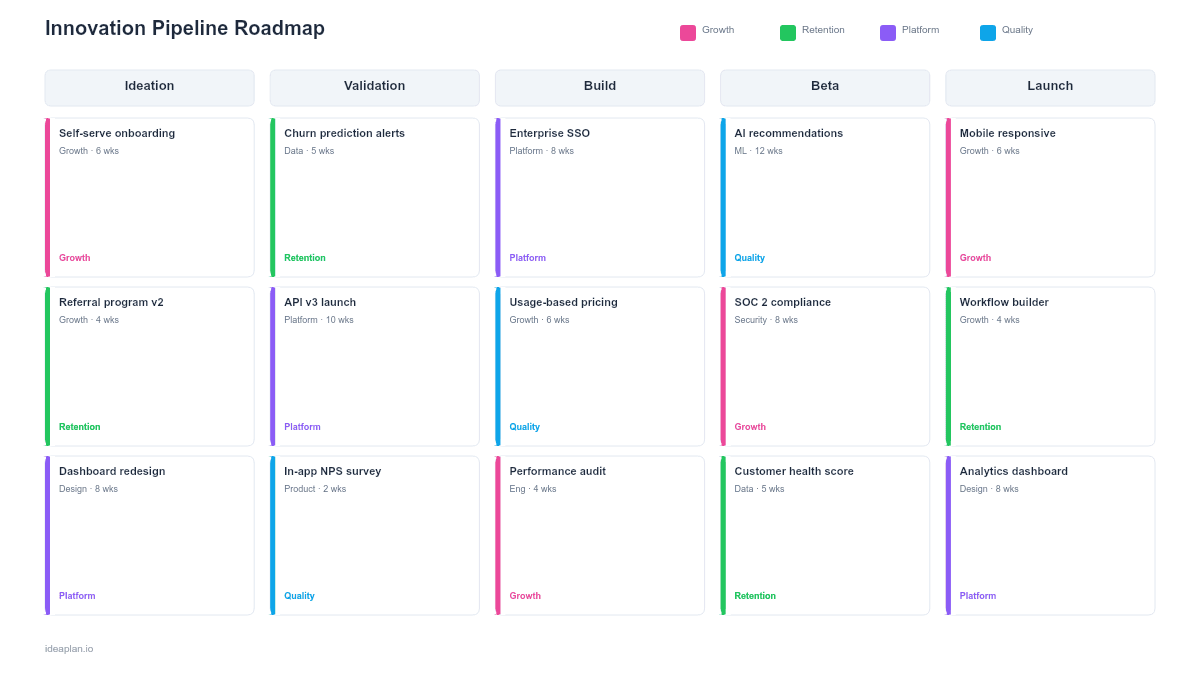
- Pipeline funnel slide. A horizontal funnel with five stages (Ideation, Screening, Validation, Build, Launch). Each stage shows the number of ideas currently in that stage and the conversion rate from the previous stage. Individual idea cards sit within their current stage.
- Gate criteria slide. A table defining what evidence is required to pass each gate, what scores qualify, and what conditions trigger a kill decision.
Why PowerPoint for Innovation Pipelines
Innovation work is inherently uncertain, and that uncertainty makes it difficult to communicate to stakeholders who are accustomed to deterministic roadmaps. A funnel visualization solves this by showing that many ideas enter the top and few survive to launch. Which is exactly how good product discovery should work.
The PowerPoint format makes this visible in leadership reviews without requiring access to a specialized idea management tool. It also forces discipline: if the funnel shows 40 ideas in Ideation and zero in Validation, the team is generating ideas but not testing them. If the funnel shows 10 ideas in Build and none were ever in Validation, the team is building without evidence.
Template Structure
Funnel Stages
The pipeline has five stages, each narrower than the last:
Ideation. Raw ideas from customers, team members, market research, and competitive analysis. No filtering at this stage. The only requirement is a one-sentence problem statement and a hypothesis about why solving it matters. Volume matters here. Aim for 20-50 ideas per quarter.
Screening. Ideas are scored against strategic fit and estimated opportunity size. The RICE framework or weighted scoring model works well for this gate. Ideas that do not align with the product strategy or have negligible estimated impact are killed here. Expect 50-70% of ideas to be filtered out.
Validation. Surviving ideas get discovery resources: customer interviews, prototype tests, data analysis, or fake door tests. The gate requires evidence of customer demand and technical feasibility. Ideas with negative validation results are killed or sent back to Ideation with a revised hypothesis.
Build. Validated ideas enter the engineering backlog with clear requirements and success metrics. This stage maps directly to the product roadmap. The gate for exiting Build is a shippable feature that meets the definition of done.
Launch. Features are released to users with a go-to-market plan, measurement setup, and a success criteria review date. The pipeline tracks post-launch adoption metrics to close the feedback loop.
Idea Cards
Each idea card shows: idea title, submitter, current stage, days in stage, gate score, and assigned owner. Cards that have been in a stage for more than 30 days without movement are flagged in yellow. Cards in a stage for more than 60 days are flagged in red. They are either blocked or abandoned and should be explicitly killed or advanced.
Conversion Metrics
Between each stage, the template shows the conversion rate: what percentage of ideas passed the previous gate. Healthy benchmarks vary by company, but a general pattern is: Ideation to Screening (60-80% pass), Screening to Validation (30-50%), Validation to Build (40-60%), Build to Launch (80-95%).
How to Use This Template
1. Seed the pipeline with ideas
Collect ideas from multiple sources: customer support tickets, user research, sales feedback, team brainstorms, and competitive analysis. Enter each as an idea card in the Ideation column. Do not filter at this stage. Quantity matters more than quality when seeding the funnel.
2. Run screening gates monthly
Once a month, review Ideation ideas against your scoring criteria. Score each idea on strategic alignment, estimated impact, and feasibility. Move passing ideas to Validation and kill ideas that do not meet the threshold. Be willing to kill 50% or more. A pipeline that advances everything is not filtering effectively.
3. Invest in validation sprints
Allocate dedicated time for discovery work on Validation-stage ideas. This might be a design sprint, a set of customer interviews, or a prototype test. The validation gate should produce concrete evidence: interview quotes, test results, or usage data. "The team feels good about it" is not evidence.
4. Connect to the product roadmap
Ideas that pass the Validation gate become candidates for the Build stage. Transfer them to your quarterly roadmap or feature roadmap with the validation evidence attached. This creates a clear audit trail from idea to shipped feature.
When to Use This Template
Innovation pipelines work best when:
- The team generates more ideas than it can build and needs a structured filter
- Leadership wants visibility into early-stage exploration without micromanaging it
- Past product bets failed because ideas were built without validation evidence
- Multiple sources of input (customers, sales, engineers, executives) compete for roadmap space
- The organization values discovery as a formal discipline, not an ad-hoc activity
If your team has a clear backlog with validated items ready to build and does not need a discovery process, a feature prioritization matrix is more appropriate. The innovation pipeline adds value specifically when the problem is not "what to build next" but "which ideas to invest in validating."
Key Takeaways
- The innovation pipeline funnel tracks ideas from concept to launch with evidence gates at each stage.
- Expect high attrition: 50-70% of ideas should be killed at Screening, and only validated ideas should enter Build.
- Stage-time flags (30-day yellow, 60-day red) prevent ideas from stalling without an explicit decision.
- Connect the pipeline to your product roadmap so validated ideas flow directly into quarterly planning.
- Track conversion rates between stages to calibrate your discovery investment and identify process bottlenecks.
- Compatible with Google Slides, Keynote, and LibreOffice Impress. Upload the
.pptxto Google Drive to edit collaboratively in your browser.