Quick Answer (TL;DR)
This free PowerPoint template structures your CX improvement plan around lifecycle stages. From first impression through renewal. Each stage shows current satisfaction scores, target scores, and the initiatives that will close the gap. Download the .pptx, map your touchpoints, and present a CX roadmap that ties experience improvements to retention and revenue.
What This Template Includes
- Cover slide. Product name, planning period, and aggregate CSAT or NPS score as the headline metric.
- Instructions slide. How to identify high-impact touchpoints, set satisfaction baselines, and prioritize improvements. Remove before presenting.
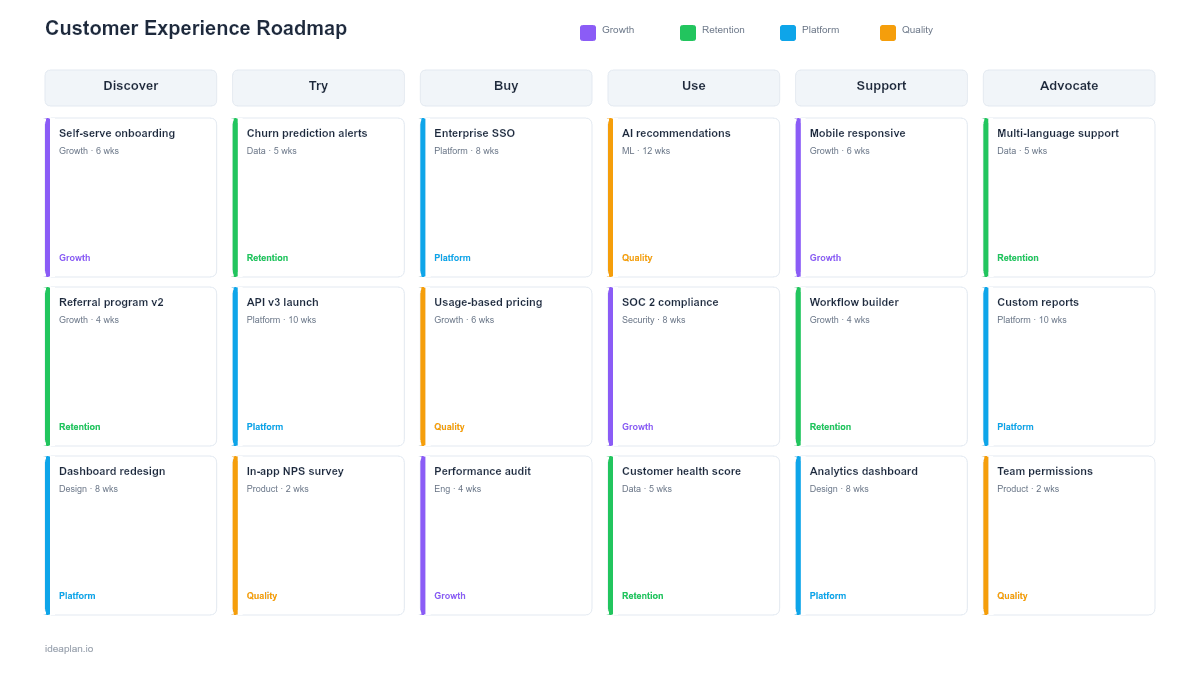
- Blank template slide. Five lifecycle columns (Awareness, Onboarding, Usage, Support, Renewal) with touchpoint rows, satisfaction gauges, and initiative cards.
- Filled example slide. A B2B SaaS CX roadmap tracking improvements across signup flow, onboarding emails, in-app help, support response times, and renewal outreach. Each touchpoint shows current and target satisfaction scores with specific improvement initiatives.
Why CX Roadmaps
Product teams ship features. CX roadmaps ship experiences. The difference matters because customers do not evaluate your product feature by feature. They evaluate the end-to-end experience of getting a job done.
A CX roadmap forces cross-functional visibility. The signup page belongs to marketing. Onboarding belongs to product. Support belongs to the support team. But the customer experiences all three as a continuous flow. When the handoff between marketing's promise and product's reality is rough, no single team owns the problem. A CX roadmap makes these gaps visible.
CX improvements also compound. A 10% improvement in onboarding satisfaction reduces support load downstream. Faster support resolution improves renewal rates upstream. The customer journey map identifies where these cascading effects exist in your product.
Template Structure
Lifecycle Columns
The roadmap uses five lifecycle stages as columns, read left to right:
- Awareness. First encounter with your brand or product. Touchpoints: website, ads, word-of-mouth, analyst reports.
- Onboarding. First experience after signup. Touchpoints: welcome flow, setup wizard, first-use tutorial, initial data import.
- Usage. Ongoing product interaction. Touchpoints: core workflows, notifications, integrations, performance.
- Support. Help-seeking moments. Touchpoints: docs, chatbot, tickets, community forum, phone support.
- Renewal. Decision to continue. Touchpoints: renewal emails, usage reports, ROI summaries, pricing conversations.
Touchpoint Rows
Within each lifecycle column, individual touchpoints are listed as rows. Each row shows:
- Touchpoint name. "Setup wizard," "Billing page," "First support ticket."
- Current score. Satisfaction rating from surveys, CES, or CSAT data.
- Target score. Where you want to be by end of planning period.
- Gap severity. Color-coded: red (>20 point gap), yellow (10-20), green (<10).
Initiative Cards
Each touchpoint with a red or yellow gap gets 1-2 initiative cards describing the improvement. Cards include:
- Initiative name. "Redesign setup wizard," "Add proactive support triggers."
- Owning team. Product, Engineering, Support, Marketing, or cross-functional.
- Expected impact. Estimated point improvement on the satisfaction score.
- Quarter. When the initiative ships.
How to Use This Template
1. Gather your satisfaction data
Pull existing survey data, NPS scores, support CSAT, and any touchpoint-level feedback. If you lack touchpoint-level data, use aggregate scores and prioritize instrumentation as a Q1 initiative.
2. Map your critical touchpoints
You cannot improve everything at once. Identify the 8-12 touchpoints that most influence retention and expansion. The customer journey mapping guide walks through this identification process in detail.
3. Score and rank gaps
For each touchpoint, compare current satisfaction to your target. Rank gaps by business impact. A low score on the renewal touchpoint matters more than a low score on a rarely-used settings page.
4. Assign initiatives to gaps
For each red or yellow gap, define 1-2 concrete initiatives. Use RICE scoring to prioritize when multiple touchpoints compete for the same team's capacity.
5. Present and align cross-functionally
CX roadmaps only work when every team sees their piece. Present in a cross-functional meeting where product, support, marketing, and success teams can commit to their initiatives and flag dependencies.
When to Use This Template
A CX roadmap is the right tool when:
- Churn analysis points to experience problems rather than missing features
- Cross-functional handoffs are causing friction that no single team owns
- Customer satisfaction scores are flat or declining despite shipping features
- You are presenting to a C-suite audience that cares about retention and NPS trends
- Multiple teams need a shared view of who is improving which part of the customer experience
If your focus is narrower. Improving a single product workflow rather than the full lifecycle. The customer journey roadmap template is a better fit.
Featured in
This template is featured in Customer Success and Retention Roadmap Templates, a curated collection of roadmap templates for this use case.
Key Takeaways
- CX roadmaps organize improvements by lifecycle stage, not by team or feature area.
- Touchpoint-level satisfaction data makes gaps visible and priorities objective.
- Cross-functional ownership is essential. No single team controls the full customer experience.
- Focus on red and yellow gaps first. Green touchpoints need maintenance, not investment.
- PowerPoint format supports cross-functional presentations where product, support, and marketing teams align on shared CX goals.
- Compatible with Google Slides, Keynote, and LibreOffice Impress. Upload the
.pptxto Google Drive to edit collaboratively in your browser.