Quick Answer (TL;DR)
This free PowerPoint template organizes your product roadmap around measurable outcomes instead of feature lists. Each outcome includes a baseline metric, target metric, timeframe, and a set of bets (initiatives the team believes will move the number). Download the .pptx, define your outcomes, and present a roadmap that answers "what will change?" rather than "what will we build?"
What This Template Includes
- Cover slide. Product name, planning period, and the north star metric that frames the entire roadmap.
- Instructions slide. Step-by-step guide for defining outcomes, setting baselines, and structuring bets. Remove before presenting.
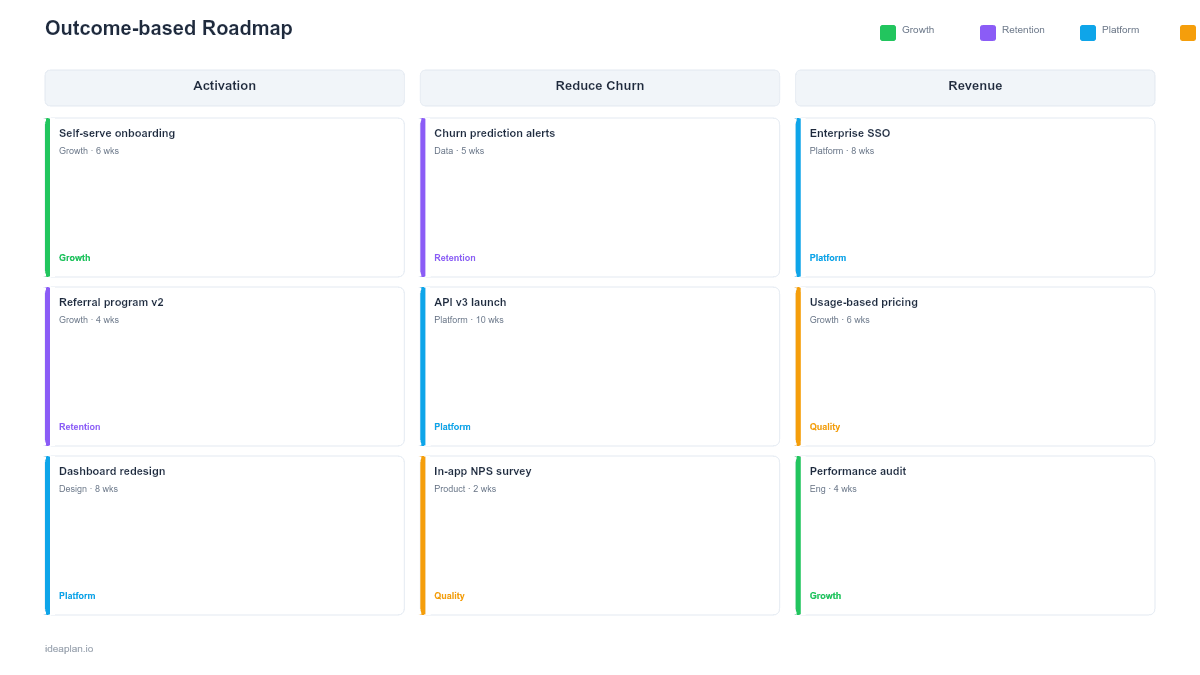
- Blank template slide. Three outcome rows, each with a metric card (baseline, target, confidence level) and space for 2-3 supporting bets.
- Filled example slide. A SaaS product roadmap with three outcomes: improve activation rate from 32% to 45%, reduce churn from 5.2% to 3.8%, and increase expansion revenue by 20%. Each outcome shows specific bets with effort estimates.
Why Outcomes Beat Feature Lists
Feature roadmaps tell stakeholders what the team will build. Outcome roadmaps tell them what will change and why it matters. The difference is significant for three reasons.
First, outcomes create alignment without micromanagement. When leadership sees "Reduce time-to-value from 14 days to 5 days," they understand the goal without needing to approve every feature decision. The team has autonomy to find the best solution.
Second, outcomes make trade-offs explicit. If two bets compete for the same engineering time, the team evaluates them against the target metric. The bet with higher expected impact wins. No politics, no loudest-voice-in-the-room. Just hypothesis-driven development.
Third, outcomes connect product work to business results. Executives care about activation rates, churn, and revenue. They rarely care about whether you built a tooltip or a wizard. The outcome roadmap speaks their language.
For a full breakdown of how to measure product outcomes, see the complete guide to product metrics.
Template Structure
Outcome Rows
The roadmap displays three outcomes as horizontal rows. Each row contains:
- Outcome statement. A plain-language description: "Reduce onboarding drop-off" or "Increase monthly active usage."
- Metric card. The specific metric, current baseline, target value, and deadline. Example: "Activation rate: 32% today, 45% by end of Q2."
- Confidence level. High / Medium / Low badge indicating how certain the team is that the bets will achieve the target.
Three outcomes is the right number for most teams. Fewer than two lacks ambition. More than four dilutes focus.
Bets
Each outcome has 2-3 bets. Initiatives the team believes will move the target metric. A bet is not a guaranteed feature. It is a hypothesis: "We believe that [initiative] will improve [metric] by [amount] because [evidence]."
Each bet card shows:
- Bet name. Short label (e.g., "Guided onboarding flow," "Usage-based email nudges").
- Expected impact. Estimated contribution to the target metric. This forces the team to think about magnitude, not just direction.
- Effort estimate. T-shirt size. Enough to assess whether the expected impact justifies the cost.
- Status. Planned, In Progress, or Validated. Updated as the team runs experiments and ships.
Metrics Summary
A footer row across the bottom shows the aggregate picture: how many outcomes are on track, how many bets are validated, and the overall confidence that the quarterly targets will be met.
How to Use This Template
1. Start with your north star
Define the one metric that captures the value your product creates. Everything on this roadmap should ladder up to it. If your north star is weekly active users, every outcome should plausibly contribute to growing that number.
2. Define 2-3 outcomes
Each outcome should be specific, measurable, and time-bound. "Improve retention" is not an outcome. "Reduce 30-day churn from 5.2% to 3.8% by end of Q2" is. Pull your baseline numbers from your analytics tool. If you do not have baseline data, your first bet should be instrumenting the metric.
3. Generate bets for each outcome
Brainstorm initiatives that could move the needle on each outcome. Use evidence from customer research, usage data, and competitor analysis. Prioritize using a framework like RICE or ICE to rank bets by expected impact relative to effort.
4. Assign confidence levels
Rate each outcome as High, Medium, or Low confidence based on the strength of evidence supporting the bets. High confidence means you have data from prior experiments or strong qualitative signals. Low confidence means the bets are educated guesses that need validation before full investment.
5. Review and adjust monthly
Check metrics against targets monthly. If a bet is not moving the metric after a reasonable period, kill it and try the next one. The roadmap is a plan, not a promise. Update confidence levels as new data arrives.
When to Use This Template
Outcome-based roadmaps are the right choice when:
- Leadership wants accountability tied to business metrics, not feature delivery
- The team has autonomy to decide how to achieve goals (empowered product teams)
- You are presenting to executives who care about results, not implementation details
- Quarterly planning needs a format that connects sprint-level work to strategic goals
- Multiple bets could address the same problem and you want to preserve flexibility
If your stakeholders require specific feature commitments with dates, an outcome-based roadmap may frustrate them. Use the quarterly PowerPoint template for date-driven audiences and reserve outcome roadmaps for strategic conversations.
Featured in
This template is featured in Product Strategy Roadmap Templates, a curated collection of roadmap templates for this use case.
Key Takeaways
- Outcome roadmaps organize work around measurable results, not feature lists.
- Each outcome includes a baseline, target, and supporting bets with expected impact.
- Confidence levels set honest expectations with stakeholders about certainty.
- Bets are hypotheses, not commitments. Kill bets that fail to move the metric.
- PowerPoint format lets you present outcome roadmaps in board reviews and planning meetings without format conversion.
- Compatible with Google Slides, Keynote, and LibreOffice Impress. Upload the
.pptxto Google Drive to edit collaboratively in your browser.