Quick Answer (TL;DR)
This free PowerPoint template maps your system architecture evolution across quarterly milestones with component-level detail, dependency tracking, and migration phases. It gives engineering leaders a clear visual for communicating technical direction to both technical and non-technical stakeholders. Download the .pptx, replace the placeholder components with your actual systems, and present your architecture vision in your next planning session.
What This Template Includes
- Cover slide. Product name, architecture roadmap timeframe, and a one-sentence summary of the target architecture state.
- Instructions slide. Guidance on mapping components, setting migration phases, and tracking dependencies. Remove before presenting.
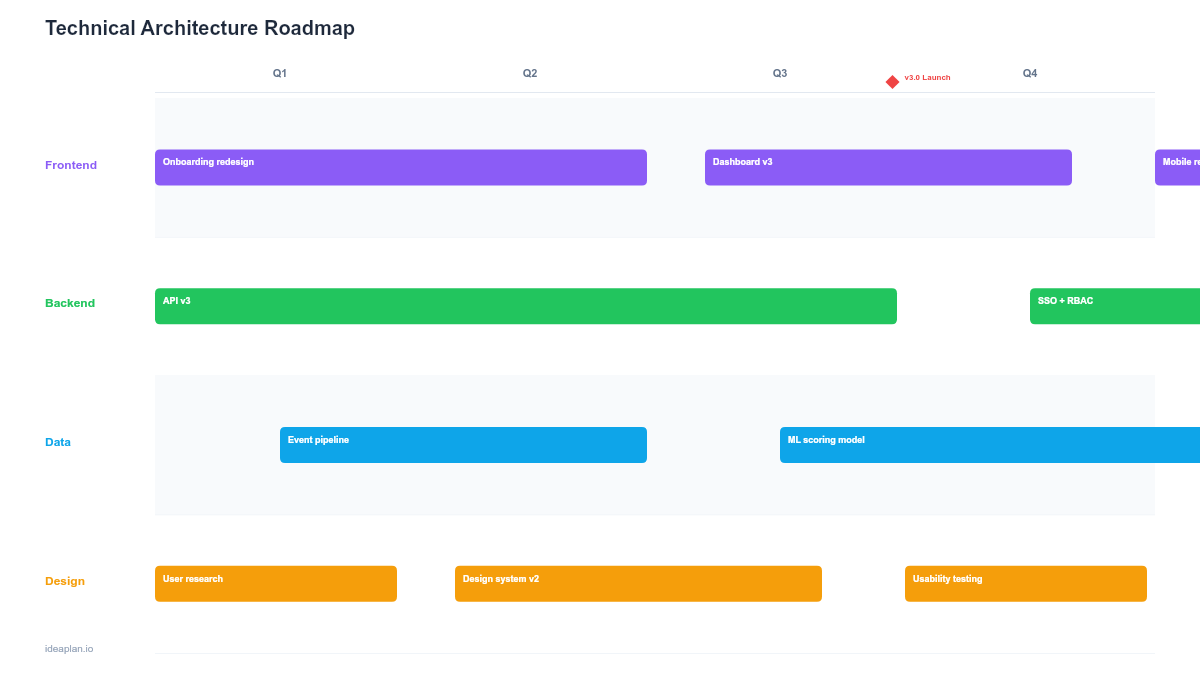
- Blank template slide. Four quarterly columns with rows for each architecture layer (infrastructure, data, services, client). Placeholder cards for each planned change.
- Filled example slide. A 4-quarter plan showing a monolith-to-microservices migration with specific service extractions, database migrations, and infrastructure changes per quarter.
Why Technical Architecture Needs Its Own Roadmap
Architecture decisions are invisible to most stakeholders until something breaks. The product roadmap shows what users get. The architecture roadmap shows what the system needs to deliver it reliably.
Without a dedicated view, architecture work gets treated as overhead. Squeezed between feature requests and staffed with whatever capacity is left over. A visible architecture roadmap forces two important conversations:
- "What technical investment enables next year's product goals?". Connecting architecture changes to product outcomes earns engineering the staffing it needs.
- "What risks are we carrying by deferring this?". Making technical debt visible prevents the slow accumulation of system fragility that eventually causes outages or blocks feature development entirely.
For teams evaluating where architecture work fits alongside feature delivery, the prioritization guide provides a structured approach to balancing these competing demands.
Template Structure
Architecture Layers
Rows represent distinct layers of your system stack. The default template includes four layers:
- Infrastructure. Cloud services, compute, networking, CI/CD pipeline changes.
- Data. Database migrations, data pipeline updates, storage architecture shifts.
- Services. Backend service creation, extraction, or consolidation.
- Client. Frontend architecture changes, SDK updates, API contract shifts.
Customize these layers to match your actual stack. A mobile-heavy product might replace "Client" with "iOS" and "Android" rows.
Quarterly Columns
Four columns represent quarters. Each column contains cards positioned in the layer row where the change occurs. The quarterly cadence matches how most organizations plan and budget for technical initiatives.
Quarter 1 should contain committed, scoped work. Quarter 4 should contain directional plans that will sharpen as you learn from earlier quarters.
Dependency Arrows
Dashed arrows between cards show cross-layer dependencies. If extracting a payment service (Services row, Q2) depends on a database migration (Data row, Q1), an arrow makes that sequencing explicit. Limit arrows to critical-path dependencies to keep the slide readable.
Risk Indicators
Each card includes an optional risk badge: Low (green), Medium (amber), High (red). High-risk items are those with significant unknowns. A new technology, a vendor migration, or a change touching multiple production systems simultaneously.
How to Use This Template
1. Define your target architecture state
Start with the end. What does your system look like in 12 months? Write a one-sentence description for the cover slide. This anchors every quarterly decision to a destination.
2. Map current pain points to architecture layers
List the technical problems blocking product velocity or reliability. Place each one in the appropriate layer row. These are your candidates for the roadmap. Refer to how product managers should approach technical debt for frameworks on evaluating which items earn a spot.
3. Sequence changes across quarters
Order changes based on dependencies and risk. High-dependency items go first. You cannot extract microservices before the service mesh is in place. Within a quarter, limit each layer to 1-2 changes to keep the plan realistic.
4. Add dependency arrows for critical paths
Draw arrows only between items where a delay in one directly blocks another. If everything has an arrow to everything else, the plan is too tightly coupled and needs restructuring.
5. Review quarterly with engineering and product leadership
Present the roadmap at the start of each quarter. Update completed items, re-evaluate risks, and adjust the remaining plan based on what you learned. Architecture roadmaps that are not updated become shelfware within two months.
When to Use This Template
The technical architecture roadmap fits when:
- Your system is undergoing a major transition. Monolith to microservices, on-prem to cloud, single-tenant to multi-tenant
- Engineering leadership needs to communicate technical investment to executives who control budgets
- Multiple teams contribute to shared infrastructure and need a coordinated view of planned changes
- Technical debt has accumulated to the point where it needs a structured paydown plan rather than ad hoc fixes
- Product and engineering are misaligned on how much capacity goes to architecture versus features
If your focus is specifically on debt reduction rather than architecture evolution, the Technical Debt Roadmap PowerPoint template provides a more targeted format. For broader technology investment planning, see the Technology Roadmap template.
Featured in
This template is featured in Technical and Engineering Roadmap Templates, a curated collection of roadmap templates for this use case.
Key Takeaways
- Architecture roadmaps connect technical investment to product outcomes, making invisible work visible to leadership.
- Layer rows (infrastructure, data, services, client) organize changes by system concern, not by team or sprint.
- Dependency arrows show critical-path sequencing. Limit them to true blockers to keep the slide readable.
- Near-quarter items should be committed and scoped. Far-quarter items should show direction without false precision.
- Update quarterly to maintain credibility and adapt to what you learn from earlier phases.
- Compatible with Google Slides, Keynote, and LibreOffice Impress. Upload the
.pptxto Google Drive to edit collaboratively in your browser.