Quick Answer (TL;DR)
This free PowerPoint template organizes your product roadmap by persona, showing which features serve which user segments, the priority level per persona, and the success metrics that define whether each segment is well-served. Download the .pptx, define your personas, map your planned features to them, and use it to ensure every user segment gets deliberate attention rather than accidental neglect.
What This Template Includes
- Cover slide. Product name, number of personas mapped, planning period, and the percentage of revenue or users each persona represents.
- Instructions slide. How to define personas, assign features, and set per-persona metrics. Remove before presenting.
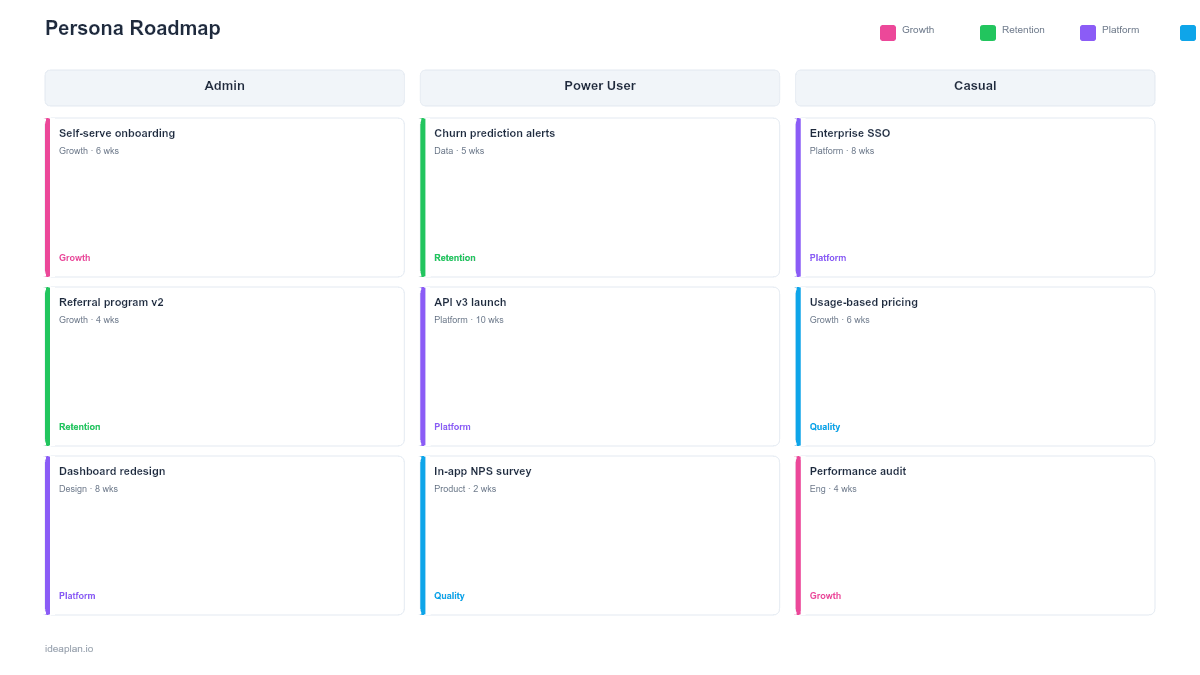
- Blank template slide. Persona columns with header cards (name, role, revenue share) and feature rows showing which personas each feature targets, with priority badges.
- Filled example slide. A B2B SaaS product with 4 personas (Admin, Power User, Casual User, Executive Sponsor), 10 planned features distributed across them, and per-persona satisfaction scores showing current gaps.
Why Organize Your Roadmap by Persona
Most roadmaps organize work by theme, quarter, or team. These structures answer "what are we building?" but not "who are we building for?" When a product serves multiple user types, that gap creates blind spots.
A persona roadmap makes investment allocation per segment visible. If your product serves both individual contributors and managers, you can see immediately whether 80% of planned features target one group while the other gets nothing. This imbalance is common and usually unintentional. It happens because the loudest internal advocates tend to represent one persona type.
The persona lens also improves prioritization. A feature that scores high on impact but only serves 5% of your user base may rank differently than a moderate-impact feature serving 60% of users. The persona roadmap surfaces these trade-offs before the team commits resources. For structured scoring that accounts for user segment reach, see the RICE framework.
Template Structure
Persona Header Cards
Each column represents one persona. The header card includes:
- Persona name and role. A descriptive label (e.g., "Engineering Manager" or "Solo Founder"), not a fictional name. Real roles communicate clearly to stakeholders.
- Segment size. Percentage of total users or revenue this persona represents. This is the weight that matters for prioritization.
- Current satisfaction. NPS, CSAT, or an internal health score for this segment. Low scores indicate underinvestment.
- Primary job to be done. The core Jobs to Be Done statement for this persona: what outcome they are hiring your product to achieve.
Feature Rows
Each row represents a planned feature. Cells in the grid show:
- Relevance badge. Primary (this feature is built for this persona), Secondary (useful but not the main target), or None (not relevant).
- Priority level. High, Medium, or Low for each persona. A feature might be High priority for the Admin persona but Low for the Casual User.
- Expected metric impact. Which per-persona metric this feature should move (e.g., "Reduce Admin setup time from 45 min to 15 min").
Persona Metric Dashboard
A summary row at the bottom tracks key metrics per persona:
- Retention rate. Monthly retention by persona segment.
- Feature adoption. Average feature adoption rate for features targeting this persona.
- Satisfaction trend. Whether the persona's satisfaction is improving, flat, or declining over the last 2 quarters.
How to Use This Template
1. Define 3-5 personas
Pull from existing user research. If you do not have formal personas, start with your top 3-4 user roles based on usage data. Avoid more than 5. Each additional persona dilutes focus. Each persona should represent a meaningfully different set of needs.
2. Assign segment weights
For each persona, calculate the percentage of total users and total revenue they represent. These numbers drive prioritization. A persona representing 40% of revenue deserves proportionally more roadmap investment than one representing 5%, unless the smaller segment is a strategic growth bet.
3. Map features to personas
For every planned feature, mark which personas it serves and at what priority level. Most features serve 1-2 personas as primary targets. If a feature is marked "Primary" for all personas, it is likely a platform improvement. Relabel it as such to avoid inflating persona-specific investment counts.
4. Check for imbalances
Look across columns. If one persona has 8 features and another has 1, investigate whether that reflects deliberate strategy or accidental bias. Cross-reference with segment weights: a persona representing 35% of users but receiving 10% of features is underserved.
5. Set per-persona targets
For each persona, define a target metric for the planning period. "Improve Admin retention from 82% to 90%" is more useful than "improve retention." Per-persona targets make it possible to evaluate whether the roadmap is actually improving the experience for each segment.
When to Use This Template
The persona roadmap PowerPoint template works best for:
- Multi-persona products where different user types have distinct needs and the team must balance investment across them
- Stakeholder conversations where sales, support, or leadership advocates for "their" persona and needs to see the full allocation picture
- Retention strategy sessions where segment-specific churn data shows that certain personas are underserved
- Growth planning where the team is deciding whether to deepen value for existing personas or expand to new ones
- Quarterly reviews where leadership wants to see product investment mapped to customer segments
If your product primarily serves one user type, a simpler format like the UX Research Roadmap PowerPoint template can track research and feature work without persona segmentation. For segment-based analysis without the roadmap overlay, the User Segmentation Roadmap PowerPoint template focuses on defining and validating segments.
Key Takeaways
- Persona roadmaps make investment allocation per user segment visible and deliberate.
- Segment weights (user count, revenue share) prevent disproportionate investment in low-impact personas.
- Feature-persona mapping reveals blind spots where entire user segments receive no planned improvements.
- Per-persona metrics (retention, adoption, satisfaction) track whether the roadmap is actually serving each segment.
- PowerPoint format makes the persona allocation presentable in quarterly reviews, stakeholder meetings, and strategic planning sessions.
- Compatible with Google Slides, Keynote, and LibreOffice Impress. Upload the
.pptxto Google Drive to edit collaboratively in your browser.