Quick Answer (TL;DR)
Knowing what to build is half the problem. Knowing who will build it. And whether they have bandwidth. Is the other half. This free PowerPoint template maps team members to initiatives with percentage-based allocation, tracks utilization rates across the quarter, and flags overcommitment before it becomes missed deadlines. Download the .pptx, plug in your team roster and planned work, and get a clear picture of whether your roadmap is staffed to succeed.
What This Template Includes
- Cover slide. Team name, planning period, headcount, and average utilization rate.
- Instructions slide. How to calculate allocations, read the utilization heat map, and handle reallocation requests. Remove before presenting.
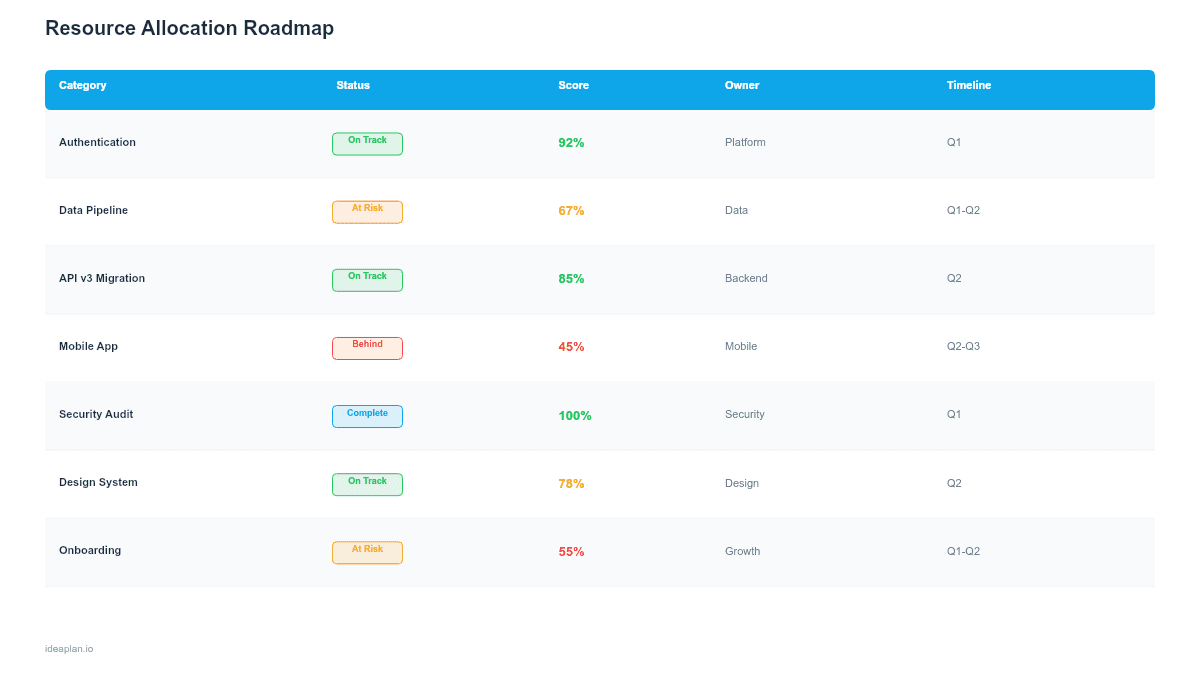
- Blank template slide. A resource allocation matrix with team members as rows, initiatives as columns, and percentage allocations in each cell. Color-coded utilization summary column on the right. A stacked bar chart below shows aggregate allocation by initiative.
- Filled example slide. An eight-person product team allocated across five initiatives plus a buffer reserve. Two engineers are highlighted in amber (90%+ utilization), and one initiative shows as under-resourced based on its effort estimate.
Why Resource Allocation Needs Its Own Artifact
The capacity planning template answers "How much total capacity do we have?" Resource allocation answers the next question: "How is that capacity distributed across specific people and specific initiatives?"
The distinction matters because capacity is not fungible. Having 1,600 available hours does not mean any engineer can work on any initiative. A backend engineer cannot build the mobile app. A junior developer cannot lead the platform migration. Resource allocation maps the actual people to the actual work, which often reveals mismatches that a top-line capacity number hides.
Teams that skip resource allocation end up in one of two failure modes. Either a few senior engineers are allocated to everything (and become bottlenecks), or an initiative is staffed with people who lack the right skills (and burns time ramping up instead of delivering). Both are preventable with 15 minutes of planning.
Template Structure
Allocation Matrix
The main artifact is a grid. Rows are team members (name and role). Columns are initiatives. Each cell contains a percentage: how much of that person's time goes to that initiative. The rightmost column sums allocations per person as the utilization rate.
Color coding for utilization:
- Green (under 80%). Healthy. Room for meetings, unplanned work, and context switching.
- Amber (80-100%). Fully loaded. Any surprise work will push something else out. Acceptable for short periods.
- Red (over 100%). Mathematically overcommitted. Something will slip. Resolve immediately.
Initiative Summary
Below the matrix, a row sums the total allocation per initiative. Compare this to the estimated effort needed. If an initiative requires 200 hours but only has 120 hours allocated, it is under-resourced. If it has 250 hours allocated, check whether the excess is intentional buffer or accidental over-assignment.
Utilization Trend
A small line chart in the corner tracks average team utilization over the past 3-4 quarters. Rising utilization suggests growing demand without matching headcount. Sustained utilization above 85% correlates with increased context-switching costs and declining velocity.
How to Use This Template
1. List your team roster with roles and skills
Start with the people, not the work. List every person on the team with their primary skill (backend, frontend, mobile, design, data, etc.) and any secondary skills. Skill tags determine which initiatives each person can realistically contribute to.
2. List planned initiatives with effort estimates
Pull the quarter's initiatives from your product roadmap. Attach an effort estimate to each one. Either hours, story points converted to hours, or T-shirt sizes with standard multipliers. Without effort estimates, allocation is guesswork.
3. Assign people to initiatives as percentages
Allocate each person's time in 10% increments. A backend engineer might be 50% on the API rewrite, 30% on the payments initiative, and 20% reserved for support rotation and unplanned work. Avoid allocating anyone to more than three initiatives simultaneously. Context switching between four or more projects destroys productivity.
4. Check for overcommitment and skill gaps
Scan the utilization column for red cells. Scan the initiative summary row for under-resourced projects. Address both: move allocation from lower-priority work, adjust timelines, or negotiate scope with stakeholders.
5. Update biweekly as reality shifts
Plans change. An engineer goes on leave. A new initiative is added mid-quarter. A project finishes early. Update allocations biweekly to keep the template useful. Stale allocation data is worse than no data because it creates false confidence.
When to Use This Template
Resource allocation templates are most valuable when:
- Your team works on multiple initiatives simultaneously and you need to track who is doing what
- Stakeholders request new work mid-quarter and you need to show the trade-off in people terms
- Key individuals are spread too thin and you need evidence to justify protecting their focus
- Sprint planning reveals that planned work exceeds available people
- Hiring conversations require data on current utilization to justify new headcount
If your team works on one initiative at a time with a clear backlog, a simple kanban roadmap may be more appropriate. Resource allocation adds value when the team juggles multiple workstreams and the PM needs to balance competing demands.
Key Takeaways
- Resource allocation maps specific people to specific initiatives, revealing mismatches that top-line capacity numbers hide.
- Color-coded utilization (green/amber/red) makes overcommitment visible before it becomes missed deadlines.
- Limit individuals to three or fewer concurrent initiatives. Context switching between four or more destroys productivity.
- Update the allocation matrix biweekly as people, priorities, and timelines shift during the quarter.
- Use allocation data to negotiate scope trade-offs with stakeholders: "Adding this initiative requires moving Engineer B off Project X, which delays it by three weeks."
- Compatible with Google Slides, Keynote, and LibreOffice Impress. Upload the
.pptxto Google Drive to edit collaboratively in your browser.