Quick Answer (TL;DR)
This free PowerPoint template organizes your product experiments into a structured pipeline. From hypothesis formation through experiment execution to validated learning. Each experiment card captures the hypothesis, method, success criteria, and outcome. Download the .pptx, populate your experiment backlog, and present a discovery roadmap that shows stakeholders how learning drives product decisions.
What This Template Includes
- Cover slide. Product area, discovery cycle dates, and the number of active hypotheses.
- Instructions slide. How to write testable hypotheses, choose experiment types, and define success criteria. Remove before presenting.
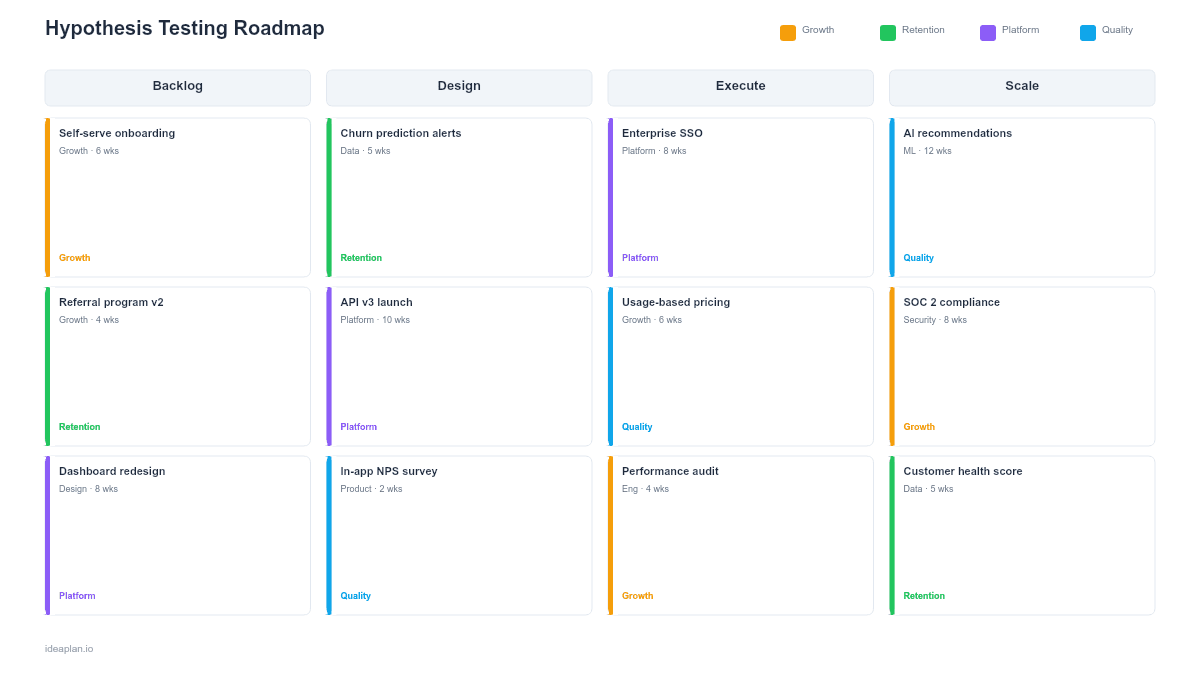
- Blank template slide. Four-column pipeline (Hypothesis Backlog, Designing, Running, Validated) with experiment cards that track method, duration, sample size, and outcome.
- Filled example slide. A B2B SaaS team running four parallel experiments: a fake door test for a new feature, an onboarding A/B test, a pricing page prototype test, and a customer interview series. Each card shows the hypothesis statement, experiment method, success criteria, and current status.
Why Hypothesis-Driven Roadmaps
Most product roadmaps assume the team already knows what to build. Hypothesis-driven roadmaps assume they do not. And that running experiments is the fastest path to finding out.
This matters most in three scenarios. First, when entering a new market where customer needs are unclear. Second, when existing features are underperforming and the team does not know why. Third, when leadership is debating multiple strategic directions and needs evidence to decide.
A hypothesis testing roadmap makes the discovery process visible. Instead of a team disappearing for six weeks and returning with a recommendation, stakeholders see the pipeline: what hypotheses are queued, what experiments are running, and what the team has learned so far. This builds confidence that the team is moving systematically, not guessing.
For a deeper dive into structuring discovery work, see the complete guide to product discovery.
Template Structure
The Four-Column Pipeline
Experiments move left to right through four stages:
- Hypothesis Backlog. Hypotheses waiting to be tested. Prioritized by expected learning value and strategic relevance. A backlog of 8-15 hypotheses is typical for a quarter.
- Designing. Experiments being set up. The team is choosing the method, defining success criteria, building prototypes, or recruiting participants. Limit: 2-3 at a time.
- Running. Live experiments collecting data. Duration and sample size are displayed so stakeholders know when results will arrive. Limit: 2-4 concurrent experiments.
- Validated. Completed experiments with clear outcomes. Marked as Confirmed, Rejected, or Inconclusive. Learning summaries are attached.
Experiment Cards
Each card in the pipeline contains:
- Hypothesis statement. Follows the format: "We believe [action] will cause [outcome] for [audience] because [evidence/reasoning]." Keep it specific and falsifiable.
- Method. The experiment type: A/B test, fake door test, prototype test, customer interviews, usability test, concierge test, or data analysis.
- Success criteria. The metric threshold that determines whether the hypothesis is confirmed. Example: "Signup rate increases by at least 15% with 95% confidence."
- Duration. How long the experiment runs. Most A/B tests need 2-4 weeks for statistical significance. Qualitative tests run shorter.
- Status. Queued, Designing, Running, or Complete with outcome.
Learning Summary
A bottom section aggregates results across the quarter: number of hypotheses tested, confirmation rate, key learnings, and decisions made based on validated results. This is the section investors and executives care about most.
How to Use This Template
1. Generate hypotheses from multiple sources
Good hypotheses come from customer research, usage analytics, support tickets, competitor observations, and team intuition. Write each as a testable statement. "Users want better onboarding" is not a hypothesis. "Adding a progress bar to onboarding will increase completion rate from 40% to 55% because users drop off when they cannot see how much remains" is.
2. Prioritize by learning value
Not all hypotheses are equally important. Prioritize based on two factors: how much the answer changes your product direction, and how quickly you can get a reliable answer. A hypothesis that takes one week to test and could change your Q2 roadmap is higher priority than one that takes six weeks and informs a future feature.
3. Choose the right experiment method
Match the method to the question. Quantitative questions ("Will this increase conversion?") need A/B tests or multivariate tests. Qualitative questions ("Why are users dropping off?") need interviews or usability tests. Demand questions ("Would users pay for this?") need fake door tests or landing page tests.
4. Set success criteria before running
Define what "confirmed" means before starting the experiment. This prevents post-hoc rationalization where the team reinterprets ambiguous results to match their preference. Write the success criteria on the experiment card before the first data point arrives.
5. Close the loop with decisions
Every validated hypothesis should link to a product decision. If the hypothesis is confirmed, what will you build? If rejected, what will you try next? A discovery roadmap without decisions is just research theater.
When to Use This Template
Hypothesis testing roadmaps are the right choice when:
- You are in a discovery phase and need to validate assumptions before committing engineering resources
- Stakeholders want evidence behind product decisions, not just opinions
- Multiple product directions are being debated and the team needs data to choose
- Features are shipping but not performing and you need to diagnose why through experiments
- You are presenting to a data-driven leadership team that values learning velocity
If your team has already validated what to build and needs to plan delivery, switch to an agile release train roadmap or sprint plan template.
Key Takeaways
- Hypothesis testing roadmaps make discovery visible as a pipeline from backlog to validated learning.
- Every experiment card captures the hypothesis, method, success criteria, and outcome.
- Set success criteria before running experiments to prevent post-hoc rationalization.
- A 50-70% rejection rate is healthy. It means you are testing genuinely uncertain ideas.
- PowerPoint format lets you present your discovery pipeline alongside delivery roadmaps in planning meetings and stakeholder reviews.
- Compatible with Google Slides, Keynote, and LibreOffice Impress. Upload the
.pptxto Google Drive to edit collaboratively in your browser.