Quick Answer (TL;DR)
This free PowerPoint template tracks feature gaps across platforms. Web, mobile, API, desktop, or any surface your product runs on. It includes a gap analysis matrix, a priority scoring view, and a quarterly convergence timeline that shows when each platform catches up on missing capabilities. Download the .pptx, audit your feature gaps by platform, and use it to align engineering teams around a shared parity plan instead of letting each platform drift further apart.
What This Template Includes
- Cover slide. Product name, platforms covered, and product owner responsible for parity.
- Instructions slide. How to inventory features by platform, score gaps by user impact, and set convergence targets. Remove before presenting.
- Blank gap analysis matrix slide. A grid with features on rows and platforms on columns. Each cell is marked present, partial, or missing, with a color-coded severity rating. A summary row shows the parity percentage per platform.
- Blank parity timeline slide. A four-quarter timeline with rows per platform showing which gaps close in which quarter, with convergence milestones marking when platforms reach 90% and 100% parity.
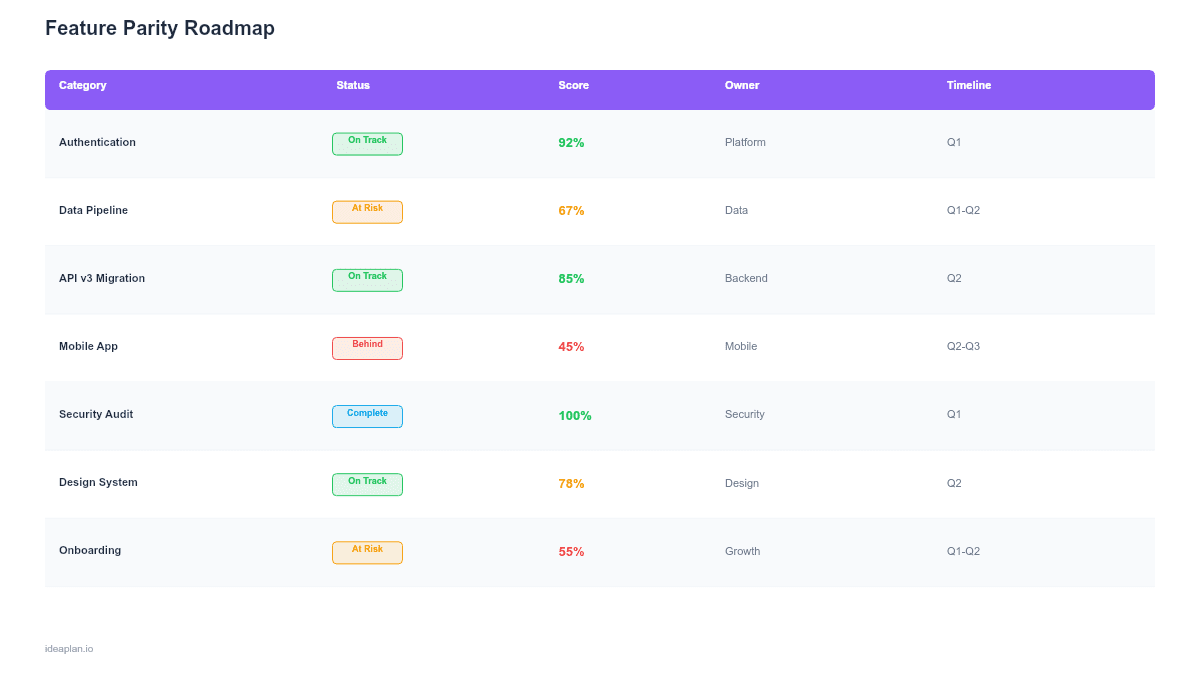
- Filled example slide. A realistic parity roadmap for a SaaS product with web, iOS, Android, and API surfaces, showing 12 feature gaps, priority scores, and a convergence plan that reaches 95% parity by Q3.
Why PowerPoint for Feature Parity Roadmaps
Feature parity conversations are some of the most contentious in product planning. Mobile teams argue their platform deserves new features, not catch-up work. Web teams wonder why they should wait for mobile to reach parity before launching the next iteration. API teams feel forgotten entirely. Without a shared artifact, each platform team optimizes locally and the gap widens.
A PowerPoint matrix makes the gap visible and indisputable. When stakeholders can see that iOS is missing 8 features the web has, and 3 of those are in the top-10 most-used features, the conversation shifts from opinion to data. The timeline view then turns that gap analysis into a plan with dates, making parity a scheduled outcome rather than a vague aspiration.
Template Structure
Gap Analysis Matrix
The matrix lists every feature on the left and every platform across the top. Each cell uses three states: full (feature is complete and equivalent), partial (feature exists but with reduced functionality), and missing (feature is not available on this platform). A severity column scores each gap by user impact using a simple high/medium/low rating based on feature usage frequency data.
Priority Scoring View
Gaps are sorted by priority score, calculated from three factors: user impact (how many users on the affected platform need this feature), revenue impact (how much the gap affects conversion or retention on that platform), and engineering effort (how much work it takes to close the gap). This mirrors RICE scoring adapted for parity-specific decisions.
Convergence Timeline
A quarterly timeline with rows per platform showing which gaps close each quarter. Convergence milestones mark key thresholds: 80% parity (minimum viable for platform-specific marketing), 95% parity (acceptable for enterprise customers who need consistent cross-platform behavior), and 100% parity (full equivalence). Each gap card on the timeline shows the effort estimate and the platform team responsible.
How to Use This Template
1. Inventory features by platform
Build a complete feature list from your web product (typically the most feature-rich surface) and check each feature against every other platform. Be specific. "search" is too broad. Break it into "full-text search," "filter by date range," "saved searches," and "search export." Partial implementations count as partial, not complete. The product requirements document for each feature should specify the expected behavior per platform.
2. Score gaps by user impact
Not all gaps matter equally. A missing export feature on mobile may be irrelevant if 98% of exports happen on desktop. Use platform-specific feature adoption data to weight each gap. High-impact gaps are features that users actively request or that cause platform-specific churn. Low-impact gaps are features that exist on web but have near-zero usage even there.
3. Group gaps into convergence sprints
Cluster related gaps into themed sprints rather than closing them one at a time. "Mobile reporting parity" is a coherent sprint; "random mix of 6 small gaps" is not. Themed sprints let engineering teams build shared components that close multiple gaps at once, and they give marketing a clear story: "Full reporting now available on iOS and Android."
4. Set convergence milestones and communicate them
Pick a target parity percentage per quarter and communicate it to stakeholders. Use the timeline to show progress toward convergence. Share the gap matrix with customer-facing teams so they can set expectations: "This feature is coming to mobile in Q2" is a better response than "We do not have that on mobile."
When to Use This Template
A feature parity roadmap is the right tool when:
- Customers use your product across multiple platforms and expect consistent behavior
- Platform-specific churn is measurable and attributed to missing features
- Engineering teams are organized by platform and need a shared view of cross-platform priorities
- A new platform (mobile app, API, desktop) is launching and needs a structured catch-up plan
- Enterprise customers require feature equivalence across surfaces as a procurement condition
If the gap between platforms is small (fewer than 5 features) and not causing measurable churn, a standard features roadmap with platform tags is sufficient. This template adds value when the gap is large enough to need a dedicated convergence strategy.
Key Takeaways
- Feature parity roadmaps use a gap analysis matrix to make cross-platform differences visible and a convergence timeline to turn gaps into scheduled work.
- Score gaps by user impact and platform-specific usage data rather than treating all missing features as equally important.
- Group related gaps into themed convergence sprints for engineering efficiency and clearer stakeholder communication.
- Define parity as equivalent outcomes, not identical UI. Platform-native interactions that achieve the same result count as full parity.
- Require every new feature spec to include platform scope to prevent new gaps from opening while you close existing ones.
- Compatible with Google Slides, Keynote, and LibreOffice Impress. Upload the
.pptxto Google Drive to edit collaboratively in your browser.