Quick Answer (TL;DR)
This free PowerPoint template organizes e-commerce product development around the shopping funnel: Discovery, Consideration, Purchase, and Post-Purchase. Each stage shows planned initiatives alongside conversion metrics, AOV targets, and customer experience improvements. Download the .pptx, map your e-commerce initiatives to funnel stages, and use it to align product, merchandising, and marketing teams around revenue-driving work.
What This Template Includes
- Cover slide. Store name, planning period, current conversion rate, and revenue target.
- Instructions slide. How to map initiatives to funnel stages, set conversion targets, and identify high-impact optimization opportunities. Remove before presenting.
- Blank template slide. Four funnel stages across a quarterly timeline with conversion rate metrics, initiative cards, and revenue impact estimates per stage.
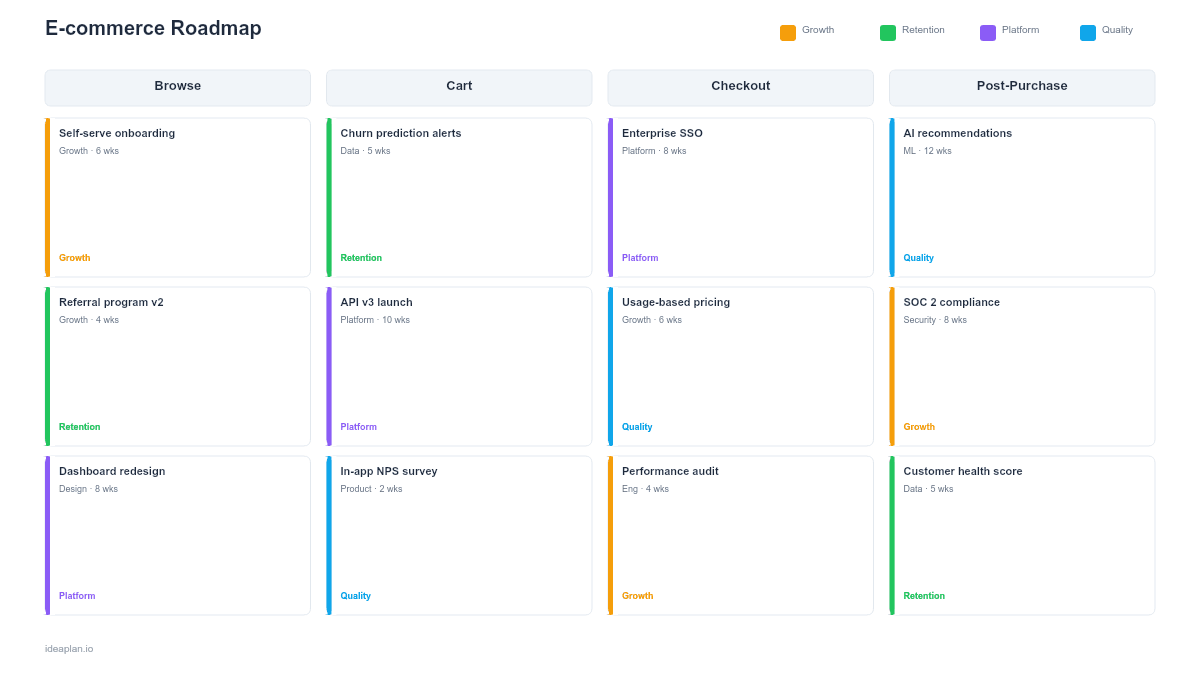
- Filled example slide. A direct-to-consumer e-commerce roadmap with 16 initiatives across four funnel stages, showing progression from search optimization through loyalty program buildout, with projected revenue lift per initiative.
Why E-commerce Products Need a Funnel-Based Roadmap
E-commerce teams measure everything in terms of the funnel: sessions, add-to-cart rate, checkout completion, repeat purchase rate. But their product roadmaps rarely reflect this structure. Instead, roadmaps organize work by team (platform, merchandising, marketing tech) or by release (Spring collection launch, Black Friday prep), losing the connection between product work and funnel performance.
A funnel-based roadmap restores that connection. Every initiative sits in the funnel stage where it has its primary impact. A redesigned product detail page affects Consideration. One-click checkout affects Purchase. A post-purchase review flow affects Post-Purchase and eventually feeds back into Discovery through social proof. This framing makes trade-offs tangible: investing in Discovery (traffic) versus Purchase (conversion) versus Post-Purchase (retention) are fundamentally different growth strategies with different payoff timelines.
The math is clarifying. If your site converts at 2.5% with 500K monthly sessions and an AOV of $85, a 0.5-point conversion improvement generates $212K in additional monthly revenue. A 10% AOV increase generates $106K. These numbers belong on the roadmap next to the initiatives designed to produce them.
Template Structure
Funnel Stage Rows
Four horizontal rows map to the shopping journey:
- Discovery. How shoppers find your products: search and SEO, paid acquisition landing pages, social commerce integration, marketplace listings, content and editorial features. Initiatives here drive sessions and new visitor volume.
- Consideration. How shoppers evaluate products: product detail pages, reviews and ratings, size/fit tools, comparison features, wishlists, personalized recommendations. Initiatives here improve add-to-cart rate.
- Purchase. How shoppers complete transactions: cart experience, checkout flow, payment options, shipping calculators, promo code UX, guest checkout. Initiatives here improve conversion rate and reduce cart abandonment.
- Post-Purchase. How customers return and refer: order tracking, review solicitation, loyalty programs, replenishment reminders, referral incentives, returns and exchange experience. Initiatives here drive repeat purchase rate and lifetime value.
Conversion Metrics
Each stage shows its conversion metric with current value and quarterly target:
- Discovery: Sessions and new visitor rate
- Consideration: Product page to add-to-cart rate
- Purchase: Cart to order completion rate
- Post-Purchase: 90-day repeat purchase rate
These four numbers tell the entire funnel story. A team that improves every stage metric by 10% relative produces a compounding revenue effect far greater than any single initiative.
Revenue Impact Estimates
Each initiative card includes an estimated revenue impact. For checkout flow optimization: current cart abandonment rate times recovered carts times AOV. For personalized recommendations: projected uplift based on industry benchmarks or prior A/B tests. These estimates create a ranked view of where each dollar of development investment generates the most return.
Seasonal Markers
Vertical markers on the timeline flag peak selling periods: Black Friday/Cyber Monday, holiday season, back-to-school, seasonal sales. E-commerce roadmaps must respect these windows. Major checkout or cart changes should not ship during peak traffic without extensive testing. A code freeze zone around Black Friday is standard practice for any e-commerce team.
How to Use This Template
1. Analyze your current funnel
Pull conversion data for each stage over the last 90 days. Identify the stage with the biggest drop-off. A site with 500K sessions, 4% add-to-cart rate, 65% cart-to-checkout rate, and 85% checkout completion rate has its biggest opportunity in Consideration (only 4% add to cart). Focusing roadmap investment on that stage produces the highest return. Use analytics to let the data pick your priority stage.
2. Brainstorm initiatives per stage
For the priority stage, generate 10-15 initiative ideas. For Consideration: better product photography, size recommendation tool, customer photo reviews, comparison feature, quick-view modal. Score each by estimated impact and development effort using the RICE framework or weighted scoring to narrow to the top 3-4 per quarter.
3. Map initiatives to the timeline
Place initiatives on the quarterly timeline. Front-load the highest-impact work. Respect seasonal constraints: ship Discovery and Consideration improvements in Q1-Q2 to capture Q4 holiday traffic. Ship Purchase optimizations before peak season, not during it.
4. Plan A/B tests
E-commerce initiatives should be validated through A/B testing before full rollout. For each initiative, define the test hypothesis, metric to measure, sample size needed, and expected duration. A checkout redesign test might need 2-3 weeks at current traffic levels to reach significance. Factor testing time into the timeline.
5. Set AOV and LTV targets
Beyond conversion, track how the roadmap affects average order value and customer lifetime value. Cross-sell recommendations in the Purchase stage can lift AOV 8-15%. Loyalty programs in Post-Purchase can increase repeat purchase rate and extend LTV by 20-30%. Include these targets alongside conversion metrics for a complete revenue picture.
6. Present to commercial leadership
E-commerce roadmaps serve a commercial audience: CMO, VP Merchandising, Head of Marketing. Lead with the revenue projection: "This roadmap targets a $1.2M quarterly revenue increase through conversion rate optimization and AOV improvement." Then walk through the funnel stages showing which initiatives produce that number.
When to Use This Template
An e-commerce roadmap is the right format when:
- Conversion rate optimization is a priority and the team needs to systematically improve each funnel stage rather than fixing issues ad hoc
- Multiple teams (product, merchandising, marketing) contribute to the shopping experience and need a shared plan that shows how their work connects
- Seasonal selling periods constrain when changes can ship and the roadmap needs to account for code freezes and peak traffic windows
- Revenue targets are tied to specific funnel metrics and leadership wants to see how product work drives those numbers
- The site is scaling from early traction to growth phase and needs to professionalize its approach to conversion optimization
For subscription-based e-commerce (box subscriptions, replenishment models), the revenue growth roadmap PowerPoint template adds recurring revenue metrics. For customer lifecycle planning beyond the purchase funnel, the customer journey roadmap PowerPoint template provides a broader lifecycle view.
Key Takeaways
- E-commerce roadmaps organized by shopping funnel stage (Discovery, Consideration, Purchase, Post-Purchase) connect product work directly to conversion metrics and revenue.
- Conversion metrics per stage with targets create a measurable improvement trajectory that the whole team can track.
- Revenue impact estimates on each initiative enable prioritization by expected return rather than opinion.
- Seasonal markers ensure major changes do not ship during peak traffic windows where risk outweighs upside.
- PowerPoint format supports presentations to commercial leadership, merchandising teams, and cross-functional planning sessions.
- Compatible with Google Slides, Keynote, and LibreOffice Impress. Upload the
.pptxto Google Drive to edit collaboratively in your browser.