Quick Answer (TL;DR)
A customer health score is only useful if it is built deliberately, calibrated against real outcomes, and connected to interventions. This free PowerPoint template walks your team through the full journey: identifying the right signals, weighting them into a composite score, setting alert thresholds, and building the playbooks that turn a red score into a save. Download the .pptx, adapt the signal list to your product, and present a phased plan for going from no health score to a system that predicts and prevents churn.
What This Template Includes
- Signal inventory slide. A catalog of engagement, support, billing, and sentiment signals available in your stack, rated by predictive value and data quality.
- Score model design slide. The composite scoring formula showing signal weights, normalization approach, and tier thresholds (healthy, at-risk, critical).
- Alert and escalation slide. Trigger rules for when scores cross thresholds, with routing logic for CSM alerts, automated interventions, and leadership escalations.
- Intervention playbook slide. Per-tier action plans detailing what the CS team does when an account moves from healthy to at-risk and from at-risk to critical.
Why Health Scoring Needs a Phased Roadmap
Teams that try to build a perfect health score on day one almost always fail. They spend months debating signal weights, build an elaborate model, launch it, and discover it does not predict churn any better than a coin flip. The problem is not the math. It is the assumption that you can get signal selection and weighting right before testing against real outcomes.
A phased roadmap solves this. Phase 1 collects signals and builds a simple score. Phase 2 tests the score against actual churn and expansion events. Phase 3 refines weights based on what the data reveals. Phase 4 connects the calibrated score to automated interventions. Each phase produces a working system that improves, rather than a theoretical model that sits in a spreadsheet.
The roadmap also creates shared expectations across product, data, and CS. Product owns signal instrumentation. Data owns the model. CS owns the interventions. Without a shared timeline, these teams build in parallel and deliver pieces that do not connect.
Template Structure
Signal Inventory
Before building a score, you need to know what signals are available and which ones predict outcomes. The signal inventory categorizes inputs across four domains:
- Engagement signals. Login frequency, feature adoption breadth, session duration, core action frequency. These measure whether customers are getting value from the product.
- Support signals. Ticket volume, escalation rate, time to resolution, sentiment in support conversations. Rising support friction often precedes churn.
- Billing signals. Payment failures, downgrade requests, late renewals, contract size changes. Billing behavior reflects commitment.
- Sentiment signals. NPS scores, CSAT responses, qualitative feedback themes. Direct input from customers about their satisfaction.
Each signal gets a data quality rating (reliable/partial/unavailable) and a preliminary predictive value estimate (high/medium/low). Signals that are unavailable become instrumentation tasks on the roadmap.
Score Model Design
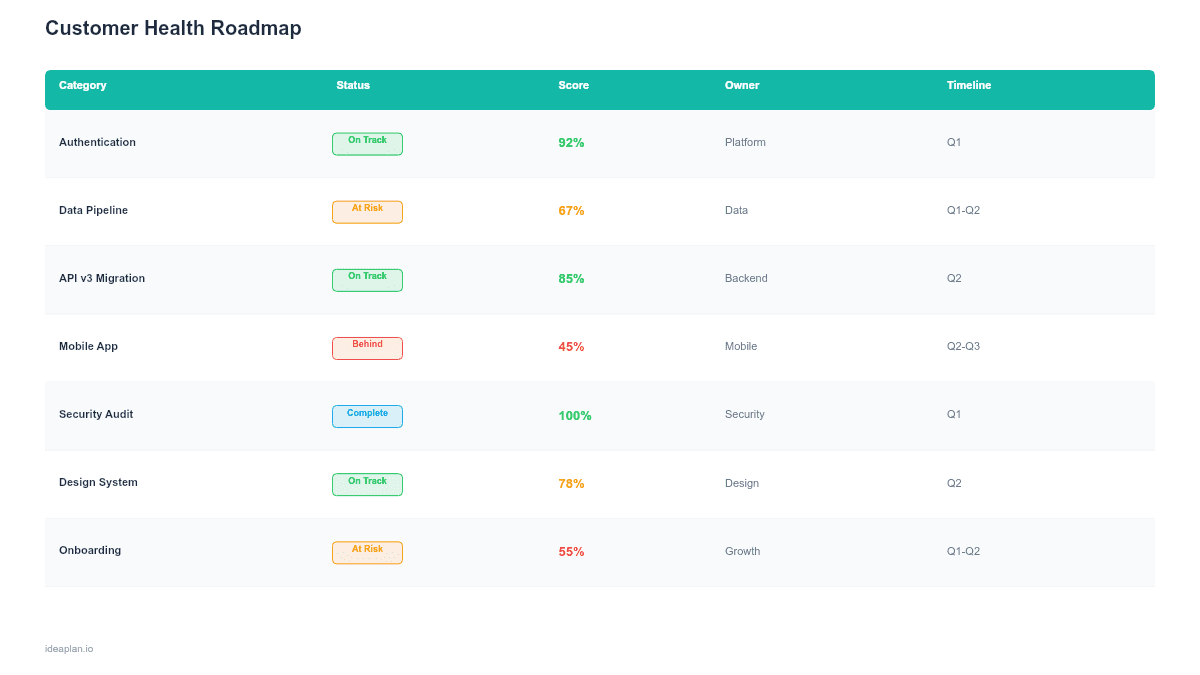
The model slide shows the composite formula. A starting approach: weight engagement signals at 40%, support signals at 25%, billing signals at 20%, and sentiment signals at 15%. Normalize each signal to a 0-100 scale. The composite score maps to three tiers:
- Healthy (70-100). No intervention needed. Monitor for expansion opportunities.
- At-risk (40-69). Proactive outreach triggered. CSM reviews the account within one week.
- Critical (0-39). Escalation to CS leadership. Intervention playbook activates immediately.
These thresholds are starting points. Phase 2 of the roadmap calibrates them against actual outcomes.
Intervention Playbooks
A health score without an intervention plan is a dashboard that generates anxiety but not action. The playbook slide defines:
- Healthy accounts. Quarterly check-in, expansion opportunity review, advocate identification.
- At-risk accounts. CSM call within 5 business days, usage review, stakeholder re-engagement, specific product training offer.
- Critical accounts. Executive sponsor engagement within 48 hours, custom success plan, concessions if appropriate, churn prevention offer.
How to Use This Template
1. Audit your available signals
List every customer data point you currently collect across product analytics, support tools, billing systems, and survey platforms. Rate each signal's data quality and availability. Gaps in this audit become Phase 1 instrumentation work. The product analytics setup guide can help if your analytics foundation needs work.
2. Build a simple v1 score
Start with the three most reliable signals you have. Typically login frequency, support ticket volume, and NPS response. Weight them equally. Calculate the score for every active account and compare the distribution against known churn events from the past 12 months. Does the score differentiate churned accounts from retained ones? If not, adjust signals before adding complexity.
3. Calibrate against real outcomes
Run the v1 score for one quarter without acting on it. At the end of the quarter, analyze: did accounts that scored as at-risk or critical actually churn at higher rates? Which signals were the strongest predictors? Adjust weights accordingly. This calibration step is essential. Skipping it means your interventions target the wrong accounts.
4. Connect alerts to interventions
Once the score predicts churn reliably, build the automation: alerts in Slack or your CS platform when accounts cross thresholds, automatic task creation for CSMs, and escalation workflows for critical accounts. The customer health score metric guide covers measurement approaches for tracking intervention effectiveness.
5. Iterate quarterly
Health scores degrade over time as customer behavior patterns shift. Review model performance quarterly: is the score still differentiating churners from retainers? Are alert volumes manageable, or is the team drowning in false positives? Adjust thresholds and weights each quarter based on fresh outcome data.
When to Use This Template
A customer health roadmap fits when:
- Your team manages renewals and retention reactively. Without a health score, every churn event is a surprise
- Multiple signals exist across different tools (product analytics, support, billing, surveys) but no one has combined them into a single view
- CS team capacity is limited and you need to prioritize which accounts get proactive attention
- Churn rate is above your target and leadership wants a data-driven approach to predicting and preventing it
- You are preparing for scale. What works with 50 accounts and manual monitoring breaks at 500 accounts
If your health score is already built and calibrated, and you need to focus on the retention actions it triggers, the Churn Prevention Roadmap provides a more focused format for intervention planning.
Featured in
This template is featured in Customer Success and Retention Roadmap Templates, a curated collection of roadmap templates for this use case.
Key Takeaways
- Build health scoring in phases: collect signals, build a simple model, calibrate against outcomes, then connect to interventions. Skipping calibration leads to false confidence.
- Four signal categories (engagement, support, billing, sentiment) cover the full picture of account health. Start with what you have; instrument what you lack.
- Thresholds (healthy/at-risk/critical) are starting points, not permanent rules. Adjust quarterly as you learn which scores actually predict churn.
- Every health tier needs a defined intervention playbook. A score without an action plan is a dashboard that creates worry without progress.
- Review model performance quarterly. Customer behavior shifts over time, and a score that predicted churn well last year may not work this year.
- Compatible with Google Slides, Keynote, and LibreOffice Impress. Upload the
.pptxto Google Drive to edit collaboratively in your browser.