Quick Answer (TL;DR)
This free PowerPoint template structures your QA improvement plan across three tracks: test automation, process integration, and quality metrics. Each slide maps specific initiatives. Building end-to-end test suites, integrating quality gates into CI/CD, establishing coverage targets. To the outcomes they produce: fewer production incidents, faster release cycles, and measurable confidence in every deploy. Download the .pptx, assess your current testing maturity, and present a plan that moves quality from a bottleneck to an accelerator.
What This Template Includes
- Cover slide. Team or product name, current quality baseline (defect escape rate, test coverage percentage, average time to detect bugs), and the planning horizon.
- Instructions slide. How to assess current testing gaps, define quality gates, and select automation targets. Remove before presenting.
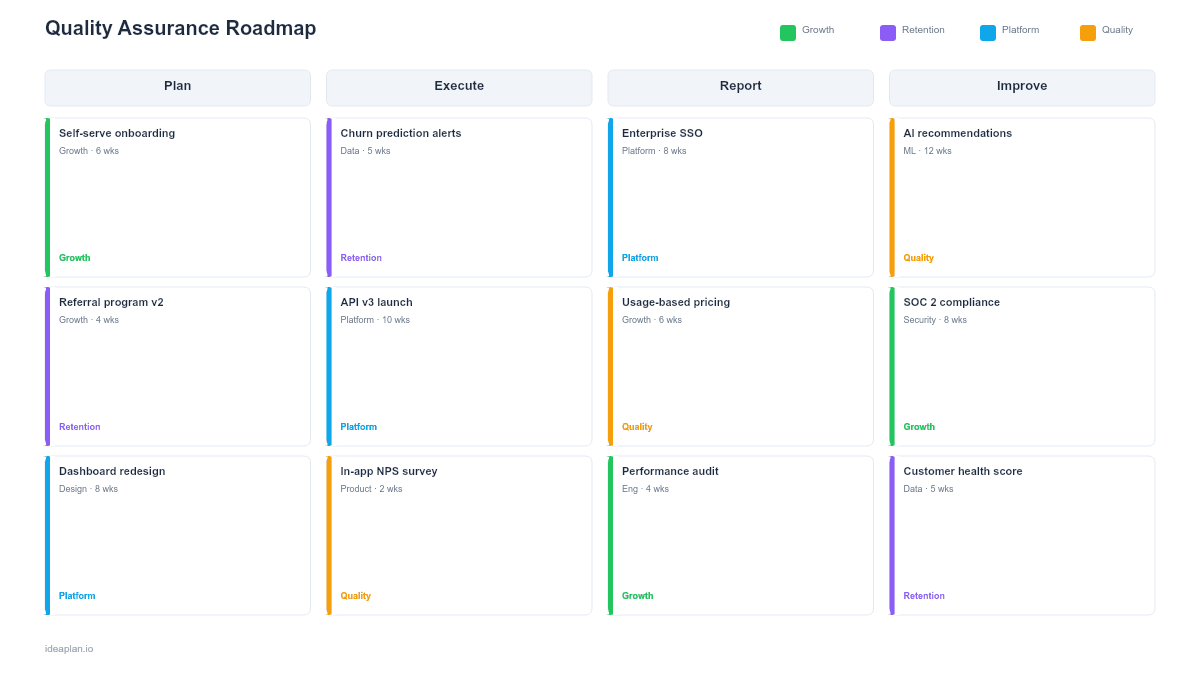
- Blank template slide. Three-track layout (Test Automation, Process Integration, Quality Metrics) across quarterly columns with initiative cards, ownership, and target metrics per track.
- Filled example slide. A product team with 40% manual testing moving to 85% automated coverage over four quarters. Shows API test automation in Q1, end-to-end test framework in Q2, CI/CD quality gate integration in Q3, and quality dashboard rollout with SLA targets in Q4.
Why Quality Assurance Needs a Roadmap
Teams that treat QA as "something QA handles" end up with a manual testing bottleneck that slows every release. The QA team becomes the gate that everyone waits on, test cycles stretch to days or weeks, and production bugs still slip through because manual testing cannot cover every path.
The alternative is treating quality as an engineering discipline with a structured improvement plan. Test automation is not something you do when you "have time". That time never arrives. It requires dedicated investment, sequenced correctly so that the highest-value tests get automated first and the infrastructure supports ongoing maintenance.
A QA roadmap makes this investment visible. It shows leadership where time goes, connects testing improvements to business outcomes (faster releases, fewer incidents, lower support costs), and creates accountability for progress. Without a roadmap, QA improvement stalls after the first enthusiastic sprint of writing tests. The error rate metric is a good starting point for quantifying the current cost of quality gaps.
Template Structure
Three Parallel Tracks
The roadmap runs three tracks that reinforce each other:
- Test Automation. Converting manual test cases to automated ones, starting with the highest-value and most frequently executed. Includes unit tests, API tests, integration tests, and end-to-end tests. Each level has different ROI characteristics: unit tests are cheap to write and maintain, end-to-end tests cover more ground but break more often.
- Process Integration. Embedding quality into the development lifecycle rather than bolting it on at the end. Quality gates in CI/CD pipelines, shift-left testing practices, code review checklists, and automated security scanning. The goal is catching defects earlier, when they are cheaper to fix.
- Quality Metrics. Defining, measuring, and reporting on quality outcomes. Defect escape rate, test coverage by component, mean time to detect, mean time to fix, and production incident frequency. Metrics without targets are just numbers; the template pairs each metric with quarterly targets.
Testing Pyramid Visualization
The filled example includes a testing pyramid showing the current and target distribution of tests across levels (unit, integration, end-to-end, manual exploratory). Most teams discover they have an inverted pyramid. Too many slow end-to-end tests, not enough fast unit tests. The roadmap corrects this imbalance over time.
Quality Gate Definitions
Each quality gate specifies what must pass before code moves to the next stage: unit tests pass with >90% coverage for changed files, integration tests pass, no critical security vulnerabilities, and performance benchmarks within SLA. The template includes a gate definition table that plugs directly into CI/CD configuration.
How to Use This Template
1. Baseline your current quality posture
Count your tests by type (unit, integration, end-to-end, manual). Measure code coverage. Pull your production incident data for the last 6 months. Calculate your defect escape rate: bugs found in production divided by total bugs found. This baseline tells you where to focus. If defect escape rate is high despite having tests, your tests are not covering the right paths.
2. Identify automation candidates with the highest ROI
Not all manual tests should be automated. Prioritize test cases that run frequently (regression suites executed every release), cover critical paths (checkout, authentication, data processing), and have stable interfaces. Flaky tests that require constant maintenance provide negative ROI. Start with stable, high-frequency, high-risk test cases.
3. Sequence by testing pyramid level
Automate unit tests first. They are fastest to write, fastest to run, and provide the tightest feedback loop. Then API and integration tests. End-to-end tests come last because they require the most infrastructure and break most often. This sequencing follows the continuous delivery principle of fast feedback.
4. Integrate quality gates into CI/CD
Once you have enough automated tests, wire them into the pipeline as gates. A pull request cannot merge without passing unit tests. A staging deploy cannot promote to production without passing integration tests. Start with advisory gates (warn but do not block) and move to enforced gates once test reliability is proven.
5. Build the quality dashboard and review weekly
Create a dashboard showing the five key metrics: defect escape rate, test coverage, change failure rate, mean time to detect, and mean time to fix. Review weekly in engineering standup. Monthly trends should show improvement. If metrics plateau despite adding tests, you are automating the wrong things.
When to Use This Template
QA roadmaps fit when:
- Manual testing is the bottleneck slowing releases and the team needs a structured automation plan
- Production incident frequency is too high and leadership wants a measurable plan to reduce defect escape rate
- Test coverage is low or unknown and the team needs to establish baselines and improvement targets
- QA is siloed from engineering and the organization wants to shift quality left into the development process
- A new CI/CD pipeline is being built and quality gates need to be defined as part of the pipeline design
If your focus is specifically on the testing strategy within an agile process rather than the full QA engineering plan, the testing strategy roadmap template is more targeted.
Featured in
This template is featured in Technical and Engineering Roadmap Templates, a curated collection of roadmap templates for this use case.
Key Takeaways
- QA roadmaps run three tracks in parallel: test automation, process integration, and quality metrics.
- Automate high-frequency, high-risk test cases first, following the testing pyramid from unit tests up to end-to-end.
- Integrate quality gates into CI/CD progressively. Start advisory, then enforce once test reliability is proven.
- Track defect escape rate and production incident frequency as primary quality outcomes, not just coverage percentages.
- PowerPoint format makes QA investment visible to non-engineering stakeholders who need to understand why testing time produces business value.
- Compatible with Google Slides, Keynote, and LibreOffice Impress. Upload the
.pptxto Google Drive to edit collaboratively in your browser.