Quick Answer (TL;DR)
Every production outage tests your incident response muscle. This free PowerPoint template plans the build-out of incident response capabilities across four domains: detection, triage, resolution, and post-incident learning. Each domain moves through maturity levels. From manual and ad-hoc to automated and systematic. On a quarterly timeline. Download the .pptx, assess your current maturity, and use the roadmap to close the gaps before the next P0 hits.
What This Template Includes
- Cover slide. Title slide with product or platform name, incident response owner, and planning period.
- Instructions slide. How to assess current maturity per domain, select target maturity levels, and sequence capability builds. Remove before external presentations.
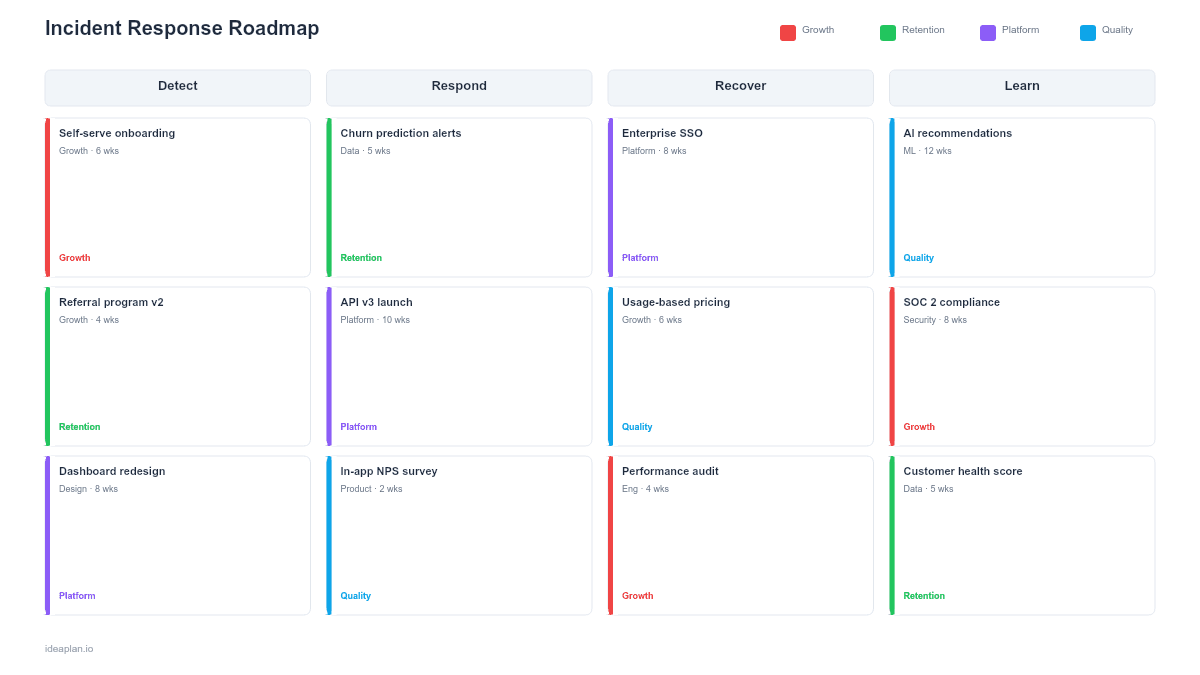
- Blank maturity timeline slide. A four-row layout (detection, triage, resolution, post-incident) with quarterly columns. Each cell shows the target maturity level and the specific capabilities being built in that quarter.
- Filled example slide. A complete incident response roadmap for a 50-person engineering organization, progressing from ad-hoc response (no runbooks, no on-call rotation) to structured response (automated alerting, defined severity levels, blameless post-mortems, and tracked action items) over four quarters.
Why Incident Response Needs a Roadmap
Most teams build incident response reactively. After a painful outage exposes gaps. The on-call rotation gets created after a Saturday night P0 with no one available. Runbooks get written after an engineer spends three hours debugging something a teammate could have fixed in twenty minutes. Post-mortems get introduced after the same root cause produces the third outage.
A roadmap flips this from reactive to proactive. Instead of waiting for incidents to expose gaps, the team systematically builds capabilities across all four domains. This is particularly important because incident response is a system, not a collection of independent tools. Faster detection is worthless without a triage process to route the alert to the right person. Faster resolution is worthless without post-incident learning to prevent recurrence.
The roadmap format also helps justify the investment. Building incident response capabilities competes with feature work for engineering time. A timeline showing mean time to recovery improvements alongside capability builds makes the business case concrete.
Template Structure
Detection Row
Detection capabilities determine how quickly your team knows something is wrong. The maturity progression runs from manual checks (someone notices the site is slow) through basic monitoring (uptime checks, error rate thresholds) to advanced observability (distributed tracing, anomaly detection, synthetic monitoring). Each quarterly milestone adds specific detection capabilities with target metrics. Alert latency in minutes from incident start to first notification.
Triage Row
Triage capabilities determine how quickly an alert reaches the right person with the right context. Maturity levels progress from ad-hoc ("who is available?") through structured rotation (defined on-call schedules, escalation paths) to automated triage (severity auto-classification, runbook linking, automated stakeholder notification). The goal is reducing the time from alert to qualified responder.
Resolution Row
Resolution capabilities determine how quickly the team fixes the problem. Progression moves from individual heroics (one senior engineer who knows everything) through documented runbooks (step-by-step guides for common failures) to automated remediation (auto-scaling, auto-rollback, self-healing infrastructure). Each level reduces mean time to recovery while also reducing the blast radius of individual knowledge gaps.
Post-Incident Row
Post-incident capabilities determine whether the team learns from failures. Maturity levels progress from no follow-up through informal debriefs to structured blameless post-mortems with tracked action items and measured completion rates. This domain is where incident response produces compounding returns. Every effective post-mortem prevents a class of future incidents.
How to Use This Template
1. Assess current maturity
For each of the four domains, honestly evaluate where the team stands today. Use the maturity scale: Level 1 (ad-hoc, reactive), Level 2 (defined, some structure), Level 3 (managed, consistent processes), Level 4 (optimized, automated and measured). Most teams are not at the same level across all domains. Detection might be Level 3 while post-incident learning is Level 1.
2. Set target maturity levels
Determine where each domain needs to be in four quarters. Not every domain needs to reach Level 4. A 20-person startup might target Level 3 detection and triage but only Level 2 post-incident process. The targets should reflect the team's size, the product's reliability requirements, and the service level agreement commitments to customers.
3. Sequence capability builds
Map specific capability builds to each quarter. Detection investments typically come first because you cannot triage what you cannot detect. Triage comes second because routing matters once alert volume increases. Resolution and post-incident processes can develop in parallel. Each quarter should deliver a usable improvement, not just lay groundwork for future quarters.
4. Assign ownership and budget
Each domain needs an owner. Typically a senior engineer or engineering manager. The incident response roadmap competes with feature work for engineering time, so secure explicit capacity allocation. Most teams find that 10-15% of engineering capacity devoted to reliability work produces meaningful improvement within two quarters.
5. Measure and adjust quarterly
Track MTTR, incident frequency by severity, and post-mortem action item completion rate. If MTTR is not improving after two quarters of investment, the capability builds are not targeting the actual bottleneck. Revisit the maturity assessment and adjust the roadmap. The product analytics setup guide covers how to instrument these operational metrics alongside product metrics.
When to Use This Template
Incident response roadmaps are essential when:
- Outages are recurring and the team is stuck in a cycle of fighting fires without reducing their frequency
- On-call is informal. There is no rotation, no escalation path, and response depends on whoever happens to be online
- Post-mortems are not happening or are happening but producing no tracked action items
- The team is scaling past 15-20 engineers, where informal incident response breaks down due to knowledge distribution
- Customers or contracts require defined SLAs and the team needs to demonstrate a credible plan to meet them
For small teams with simple architectures where one person can diagnose any issue, a formal incident response roadmap adds overhead. Start with an observability roadmap to build visibility first, then layer incident response process on top as the team and system grow.
Key Takeaways
- Build incident response capabilities proactively across four domains: detection, triage, resolution, and post-incident learning.
- Assess current maturity honestly. Most teams are not at the same level across all domains, and the weakest domain constrains the whole system.
- Sequence capability builds starting with detection, then triage, then resolution and post-incident in parallel.
- Allocate 10-15% of engineering capacity to reliability work and measure MTTR improvement quarterly to validate the investment.
- Post-incident learning produces compounding returns. Every effective post-mortem prevents a class of future incidents.
- Compatible with Google Slides, Keynote, and LibreOffice Impress. Upload the
.pptxto Google Drive to edit collaboratively in your browser.