Quick Answer (TL;DR)
This free PowerPoint dependency map template visualizes blocking relationships between teams, services, and systems so you can identify bottlenecks before they delay your roadmap. Each dependency is scored by risk level and mapped to a resolution timeline. Download the .pptx, catalog your cross-team dependencies, and use the output to negotiate delivery commitments and sequence work in the right order.
What This Template Includes
- Cover slide. Product or program name, planning period, and dependency owner.
- Instructions slide. How to identify dependencies, score risk, and read the map. Remove before presenting.
- Dependency network slide. A node-and-arrow diagram where each node is a team or system and each arrow represents a dependency. Arrows are color-coded by risk (green/yellow/red) and labeled with what is needed and when.
- Dependency register slide. A table listing each dependency with provider team, consumer team, description, risk score, resolution date, and status.
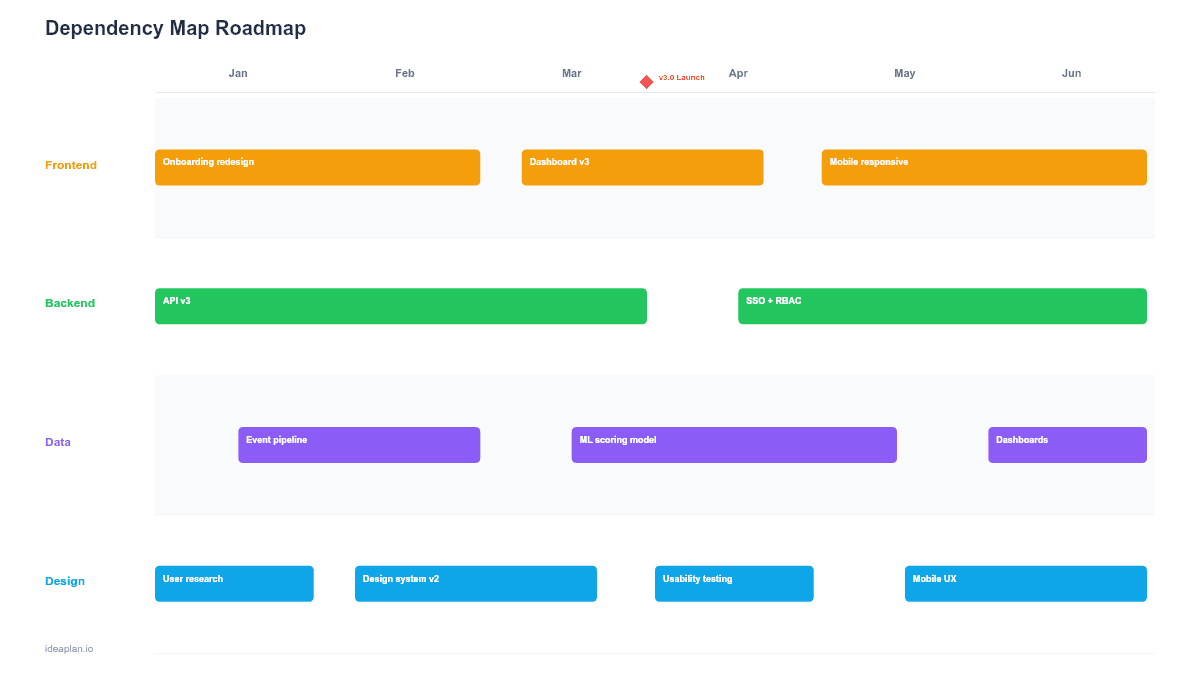
- Resolution timeline slide. A Gantt-style view showing when each dependency must be resolved, aligned to the product roadmap.
Why PowerPoint for Dependency Maps
Dependencies are the leading cause of roadmap delays in organizations with more than one product team. They are also the hardest planning element to keep visible. Dependencies live in Jira comments, Slack threads, and people's heads. None of which are useful in a planning review.
A PowerPoint dependency map pulls all of this information onto one slide. The network diagram shows the shape of your dependency graph at a glance: is the graph sparse (teams mostly independent) or dense (heavy cross-team coupling)? Dense graphs need more coordination overhead and tighter sequencing. The visual format makes this structural reality obvious to leadership in a way that a spreadsheet row never does.
Template Structure
Network Diagram
Nodes represent teams or systems. Each node is a rounded rectangle with the team name and team lead. Directed arrows connect nodes to show dependency direction: an arrow from Team A to Team B means "Team A depends on Team B." Arrow labels describe what is needed: "Auth API v2 endpoint," "Design system v3 tokens," "Data warehouse schema update."
Arrows are color-coded by risk:
- Green. Dependency is resolved or on track. No action needed.
- Yellow. Dependency is acknowledged but not yet committed. Needs follow-up.
- Red. Dependency is at risk: no owner, no commitment, or timeline conflict with the consuming team's roadmap.
Dependency Register
A structured table with one row per dependency. Fields include: dependency ID, provider team, consumer team, description of what is needed, date needed by, provider commitment date, risk score (1-5), owner, and status (open/committed/delivered). This table is the operational artifact. The network diagram is for communication, the register is for tracking.
Resolution Timeline
A Gantt view showing each dependency as a horizontal bar from identification to resolution. Bars that extend past the consumer team's need-by date are flagged in red. This view answers the critical question: "Will dependencies be resolved before the teams that need them start their work?"
How to Use This Template
1. Catalog dependencies
During sprint planning or quarterly planning, ask each team: "What do you need from another team to deliver your roadmap items?" and "What are other teams waiting on from you?" Capture both directions. Dependencies are often asymmetric. The provider team may not know they are a bottleneck until the consumer team raises it.
2. Score risk for each dependency
Rate each dependency on a 1-5 risk scale based on three factors: Is there a committed delivery date? Has the provider team allocated capacity? Is the technical approach agreed upon? A dependency with no committed date, no allocated capacity, and an open technical question scores a 5. Maximum risk.
3. Build the network diagram
Place team nodes on the slide and draw arrows. Arrange nodes to minimize arrow crossings. Teams with the most outgoing dependencies (providers) should be positioned centrally. The visual clustering reveals which teams are the most depended-upon and therefore the most impactful for de-risking the plan.
4. Negotiate commitments
For every red-arrow dependency, set up a meeting between the provider and consumer teams. The goal is to convert red arrows to yellow (acknowledged) and yellow to green (committed). Use the resolution timeline to verify that commitment dates align with consumer team start dates. The stakeholder management guide covers techniques for navigating these cross-team negotiations.
When to Use This Template
Dependency maps are essential when:
- Three or more teams are working on interdependent features within the same quarter
- Past roadmap delays were caused by cross-team handoff failures or untracked dependencies
- A platform team provides shared services consumed by multiple product teams
- Release planning requires coordinated deployments across services
- New team members or leadership need to understand the organization's dependency structure quickly
For small teams or single-product companies where most work stays within one team, a swimlane roadmap with dependency annotations may be sufficient. The full dependency map template adds value when the dependency graph is complex enough to warrant its own artifact.
Key Takeaways
- Dependency maps make cross-team blocking relationships visible before they cause roadmap delays.
- Color-coded arrows (green/yellow/red) surface the highest-risk dependencies that need immediate attention.
- Every red-zone dependency needs an owner, a committed resolution date, and a follow-up conversation between provider and consumer teams.
- Teams with many incoming dependencies are structural bottlenecks. Consider reorganizing team boundaries to internalize critical dependencies.
- Maintain a dependency register alongside the visual map for tracking status and historical patterns.
- Compatible with Google Slides, Keynote, and LibreOffice Impress. Upload the
.pptxto Google Drive to edit collaboratively in your browser.