Quick Answer (TL;DR)
This free PowerPoint A/B testing roadmap template organizes your experiment pipeline into a quarterly calendar with hypothesis definitions, sample size requirements, expected durations, and decision criteria for each test. It helps product and growth teams visualize which experiments run when, avoid traffic conflicts between concurrent tests, and track the cumulative impact of completed experiments on north star metrics. Download the .pptx, populate it with your planned experiments, and use it to align your team on testing priorities and sequencing.
What This Template Includes
- Cover slide. Title slide with product area, quarter, testing owner, and experimentation platform.
- Instructions slide. How to write hypotheses, calculate sample sizes, and read the experiment timeline. Remove before presenting.
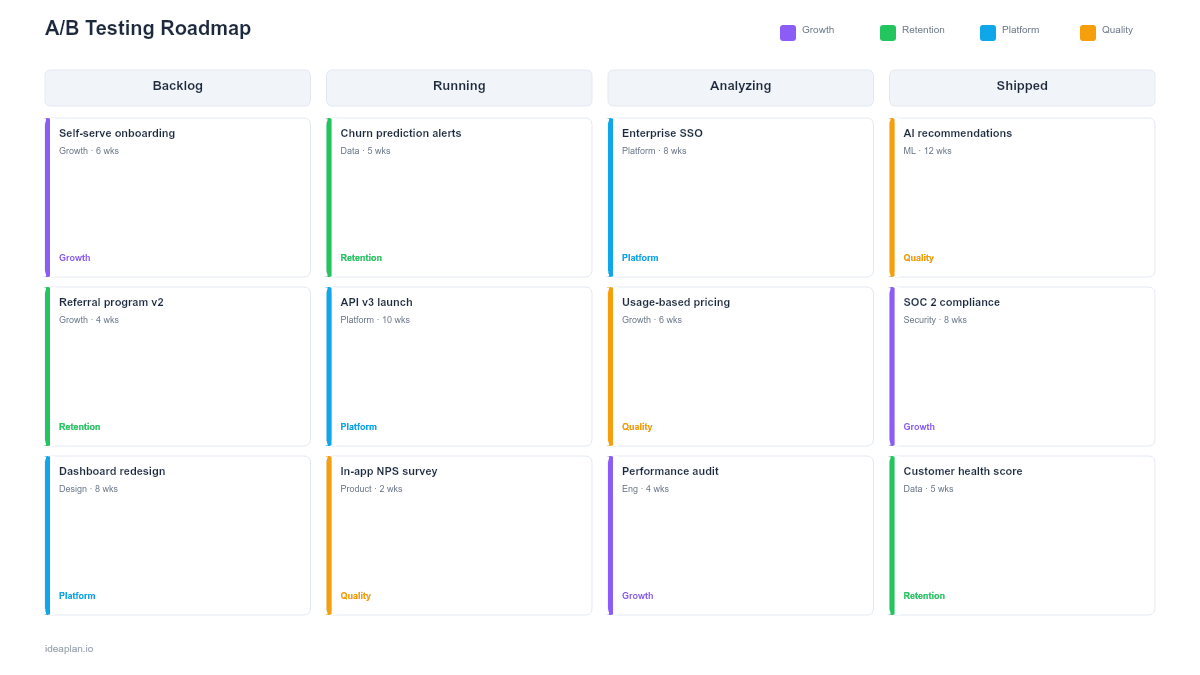
- Blank experiment pipeline slide. A calendar-style grid with rows for each product area (onboarding, checkout, engagement, retention). Each experiment card shows the hypothesis, primary metric, required sample size, estimated duration, and traffic allocation.
- Filled example slide. A realistic Q2 experiment pipeline for a B2B SaaS product showing six experiments across onboarding and conversion flows, with two experiments running concurrently on non-overlapping user segments.
Why PowerPoint for A/B Testing Roadmaps
Most teams track experiments in spreadsheets or their testing platform. Both fail at the strategic level. A spreadsheet shows a list; a testing platform shows current status. Neither shows the full quarter's experiment plan in a format that executives and cross-functional partners can quickly absorb.
PowerPoint forces you to make sequencing decisions visible. When you lay out six experiments on a quarterly timeline, traffic conflicts become obvious. You cannot run two experiments on the checkout page simultaneously without contaminating results. The slide format also makes it easier to show cumulative impact: "These four completed experiments added 3.2 percentage points to signup-to-paid conversion this quarter." That narrative is what earns continued investment in experimentation.
Template Structure
Product Area Rows
Rows group experiments by product area: onboarding, core experience, conversion, and retention. This grouping prevents traffic conflicts within the same funnel stage and shows where your testing investment is concentrated. If three of four rows are empty, you have a testing gap.
Experiment Cards
Each card contains five elements: the hypothesis ("Reducing form fields from 8 to 4 will increase signup rate by 15%"), the primary metric, required sample size, estimated run duration, and traffic allocation percentage. Cards span the weeks they occupy on the timeline.
Impact Tracker
A summary row at the bottom accumulates the measured impact of completed experiments. As tests conclude, update the row with actual results. This creates a running scorecard that demonstrates the value of a structured product experimentation program.
How to Use This Template
1. Build your experiment backlog
Collect experiment ideas from product analytics, user research, support tickets, and team brainstorms. Write each as a falsifiable hypothesis with a predicted effect size. Prioritize using ICE scoring. Impact on your target metric, confidence in the hypothesis, and ease of implementation. Aim for 8-12 candidates per quarter; you will run 4-6 after accounting for duration and traffic constraints.
2. Calculate sample sizes and durations
For each experiment, determine the minimum sample size needed to detect your predicted effect size at 95% confidence. Divide by your daily traffic to the relevant page or flow to estimate run duration. Most B2B SaaS experiments need 2-4 weeks; high-traffic consumer products can run experiments in days. If a test needs more than 6 weeks, reconsider the effect size or find a higher-traffic surface.
3. Sequence experiments to avoid conflicts
Place experiments on the timeline so that no two tests run simultaneously on the same user segment or funnel stage. If you must run concurrent experiments, use mutually exclusive audience segments and document the segmentation in the experiment card. The A/B testing guide covers exclusion group design in detail.
4. Set review cadences
Schedule weekly experiment reviews to check statistical significance, sample ratio mismatches, and unexpected metric movements. At the end of each experiment, run a formal readout: what did you learn, what is the decision (ship, iterate, kill), and how does the result change your next experiments?
When to Use This Template
A/B testing roadmaps are valuable when:
- Your team runs more than two experiments per quarter and needs to prevent traffic conflicts
- Stakeholders want visibility into what is being tested and what the results mean for product direction
- Multiple teams propose experiments on shared surfaces (homepage, checkout, onboarding) and need coordination
- You want to demonstrate ROI of experimentation by tracking cumulative metric impact
- Previous experiments have had validity issues due to overlapping tests or insufficient sample sizes
If you run one experiment at a time with no traffic constraints, a simple experiment brief is sufficient. This template adds value when you are managing a pipeline of concurrent or sequential experiments across a quarter.
Key Takeaways
- Organize experiments by product area on a quarterly timeline to prevent traffic conflicts and show testing coverage.
- Write every experiment as a falsifiable hypothesis with a predicted effect size, primary metric, and required sample size.
- Calculate run durations from daily traffic and minimum detectable effect. Do not guess how long tests should run.
- Track cumulative metric impact across completed experiments to demonstrate the ROI of a structured testing program.
- Set maximum run durations upfront and accept inconclusive results as valid learnings rather than extending indefinitely.
- Compatible with Google Slides, Keynote, and LibreOffice Impress. Upload the
.pptxto Google Drive to edit collaboratively in your browser.