Agile Roadmaps Need Flexible Tools
Traditional roadmaps lock you into a fixed timeline months in advance. Agile roadmaps do the opposite. They shift as your team learns from each sprint, customer conversation, and production release. The tool you use needs to keep up.
Google Sheets works surprisingly well for this. It is free, collaborative in real time, and imposes zero workflow opinions. You build exactly the roadmap your team needs, change it when priorities shift, and share it without onboarding anyone to new software. For a foundational walkthrough of setting up roadmaps in Google Sheets, start with our Google Sheets roadmap template guide.
The catch is that Sheets gives you a blank canvas, not a ready-made agile planning tool. If you are new to roadmapping, start with the guide to building a product roadmap for strategy and structure, then come back here for the spreadsheet implementation. This guide shows you how to structure that canvas for the most common agile roadmap formats, with formulas and templates you can copy today.
Which Agile Roadmap Format Should You Choose?
Not all agile teams plan the same way. Your roadmap format should match how your team actually works, not how you think you should work.
Sprint-based roadmaps
Organize work by two-week (or one-week) sprint cycles. Each column represents a sprint, each row an epic or feature. This format works for teams running Scrum with predictable sprint cadences.
Best for: Teams shipping every 2 weeks with a defined sprint process.
Drawbacks: Creates the illusion that you know exactly what ships in Sprint 7. You probably do not.
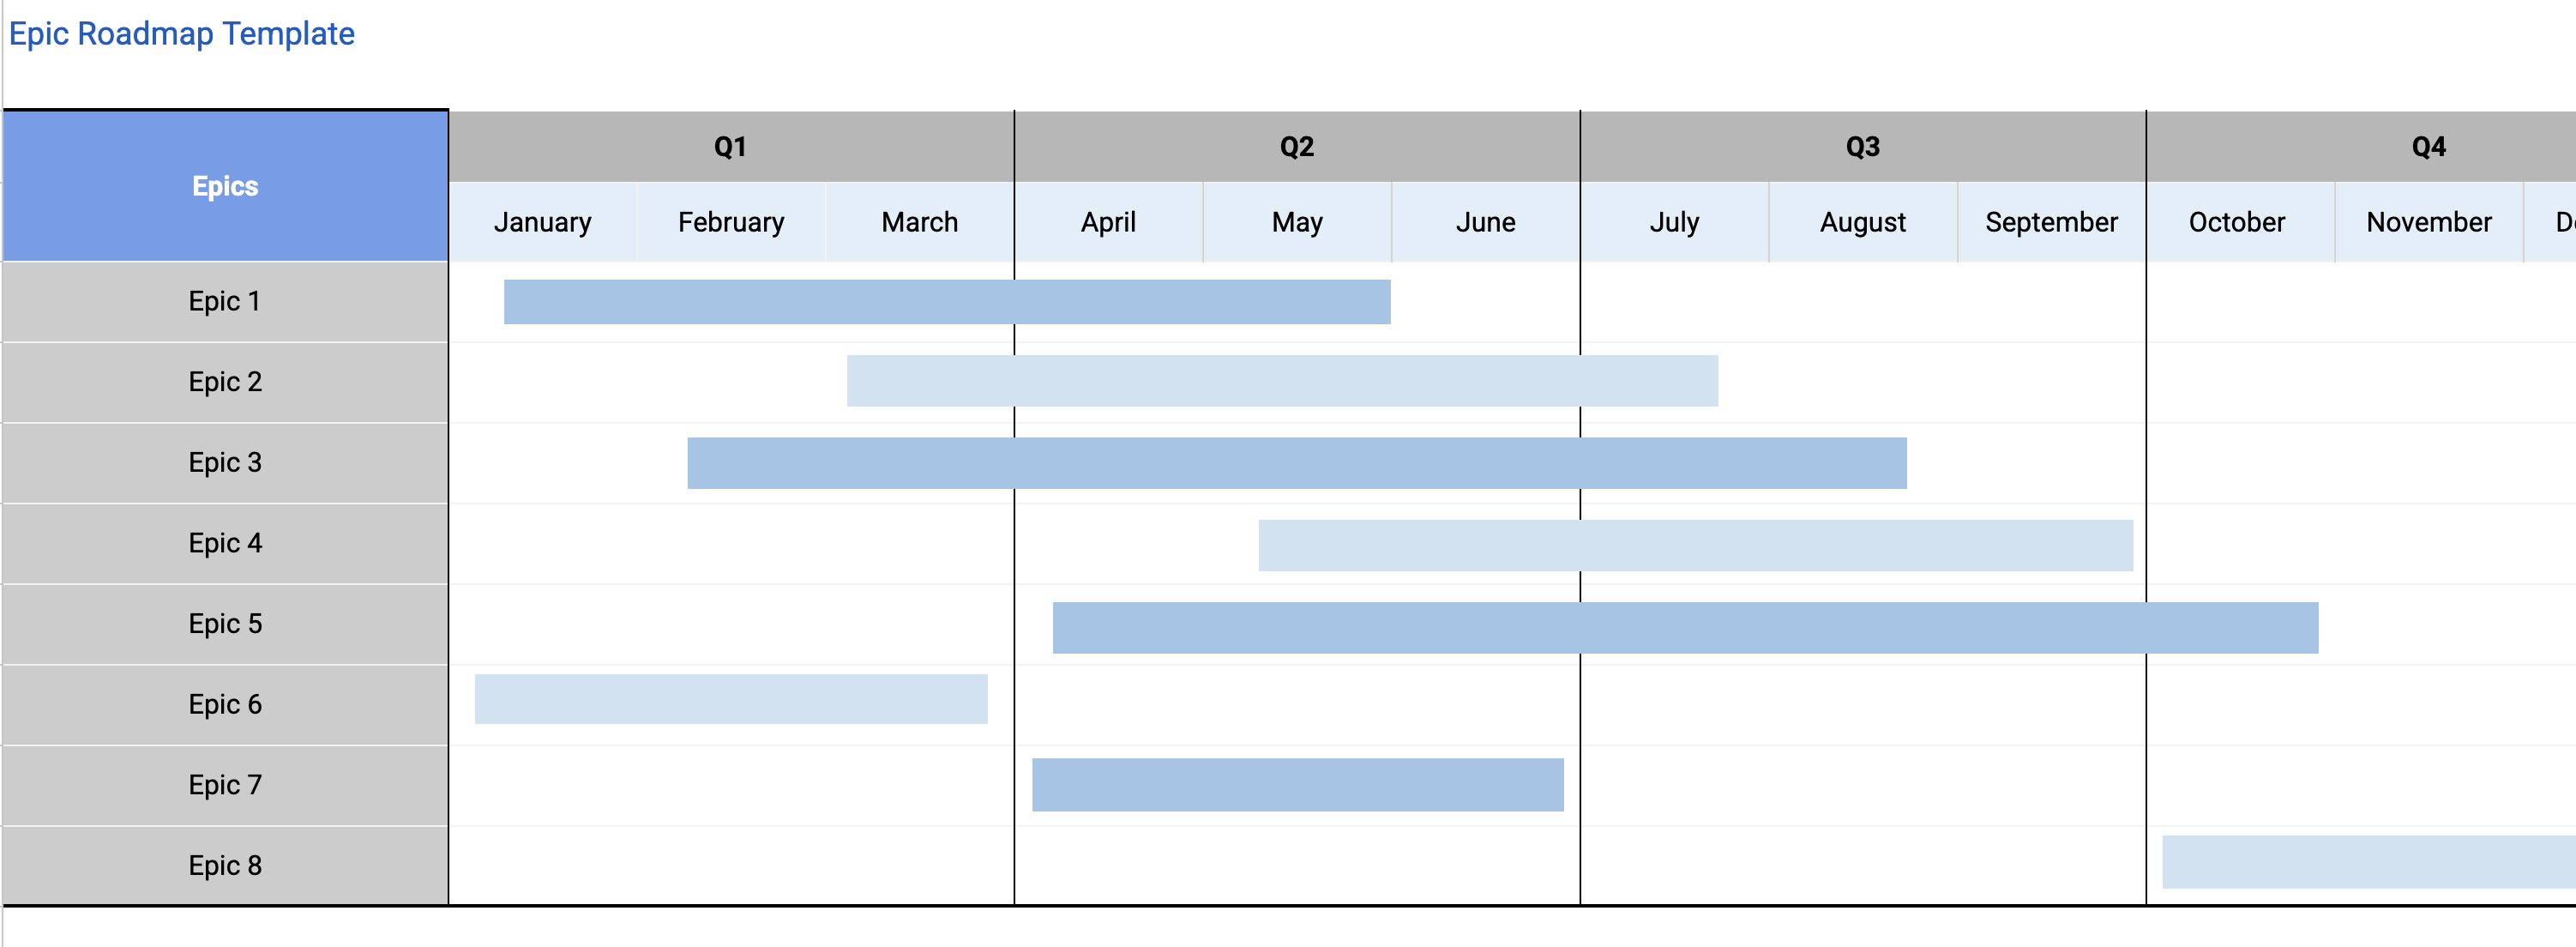
The Epic Roadmap Template gives you this structure out of the box. Columns for status, priority, owner, and timeline bars across sprints.
Kanban roadmaps
Columns represent workflow stages (Backlog, Ready, In Progress, Review, Done) rather than time periods. Items flow left to right as they progress. No sprints, no fixed iterations.
Best for: Continuous delivery teams, support/platform teams, or any team that ships when work is ready rather than on a fixed cadence. See the full kanban roadmap guide for when this format fits.
Drawbacks: Harder to forecast delivery dates. You trade predictability for flexibility.
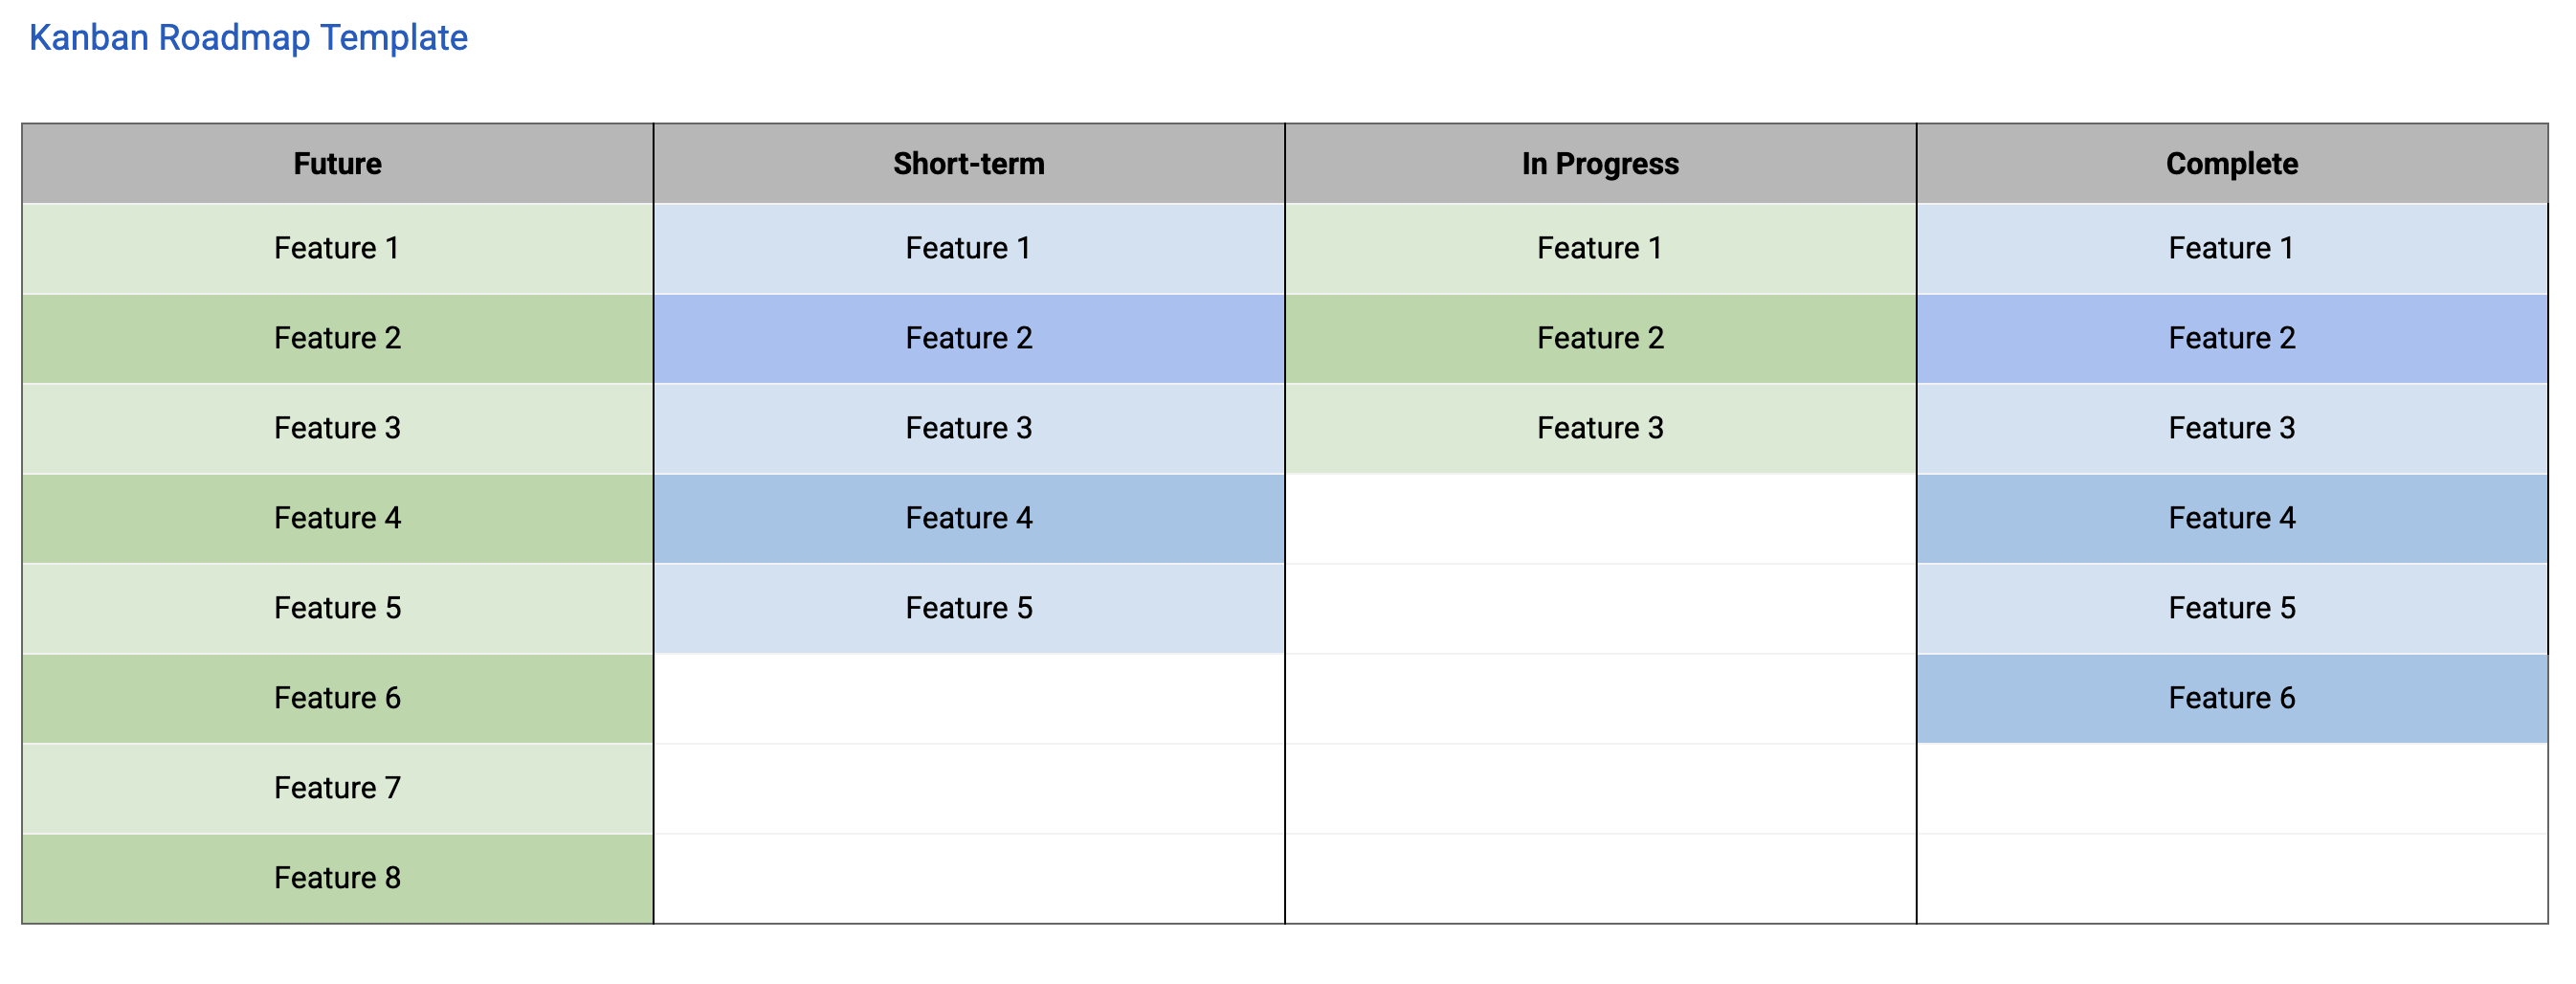
The Kanban Roadmap Template sets up the workflow columns with conditional formatting and WIP (work-in-progress) limits built in.
Release roadmaps
Group features by planned release versions rather than sprints or workflow stages. Each release has a target date, a set of features, and a status. This format suits teams shipping versioned products. Mobile apps, APIs, or anything with a formal release process.
Best for: Teams coordinating releases with marketing, sales, or external partners. See release roadmaps for the full breakdown.
Drawbacks: Can drift toward waterfall thinking if you are not careful about scope flexibility within each release.
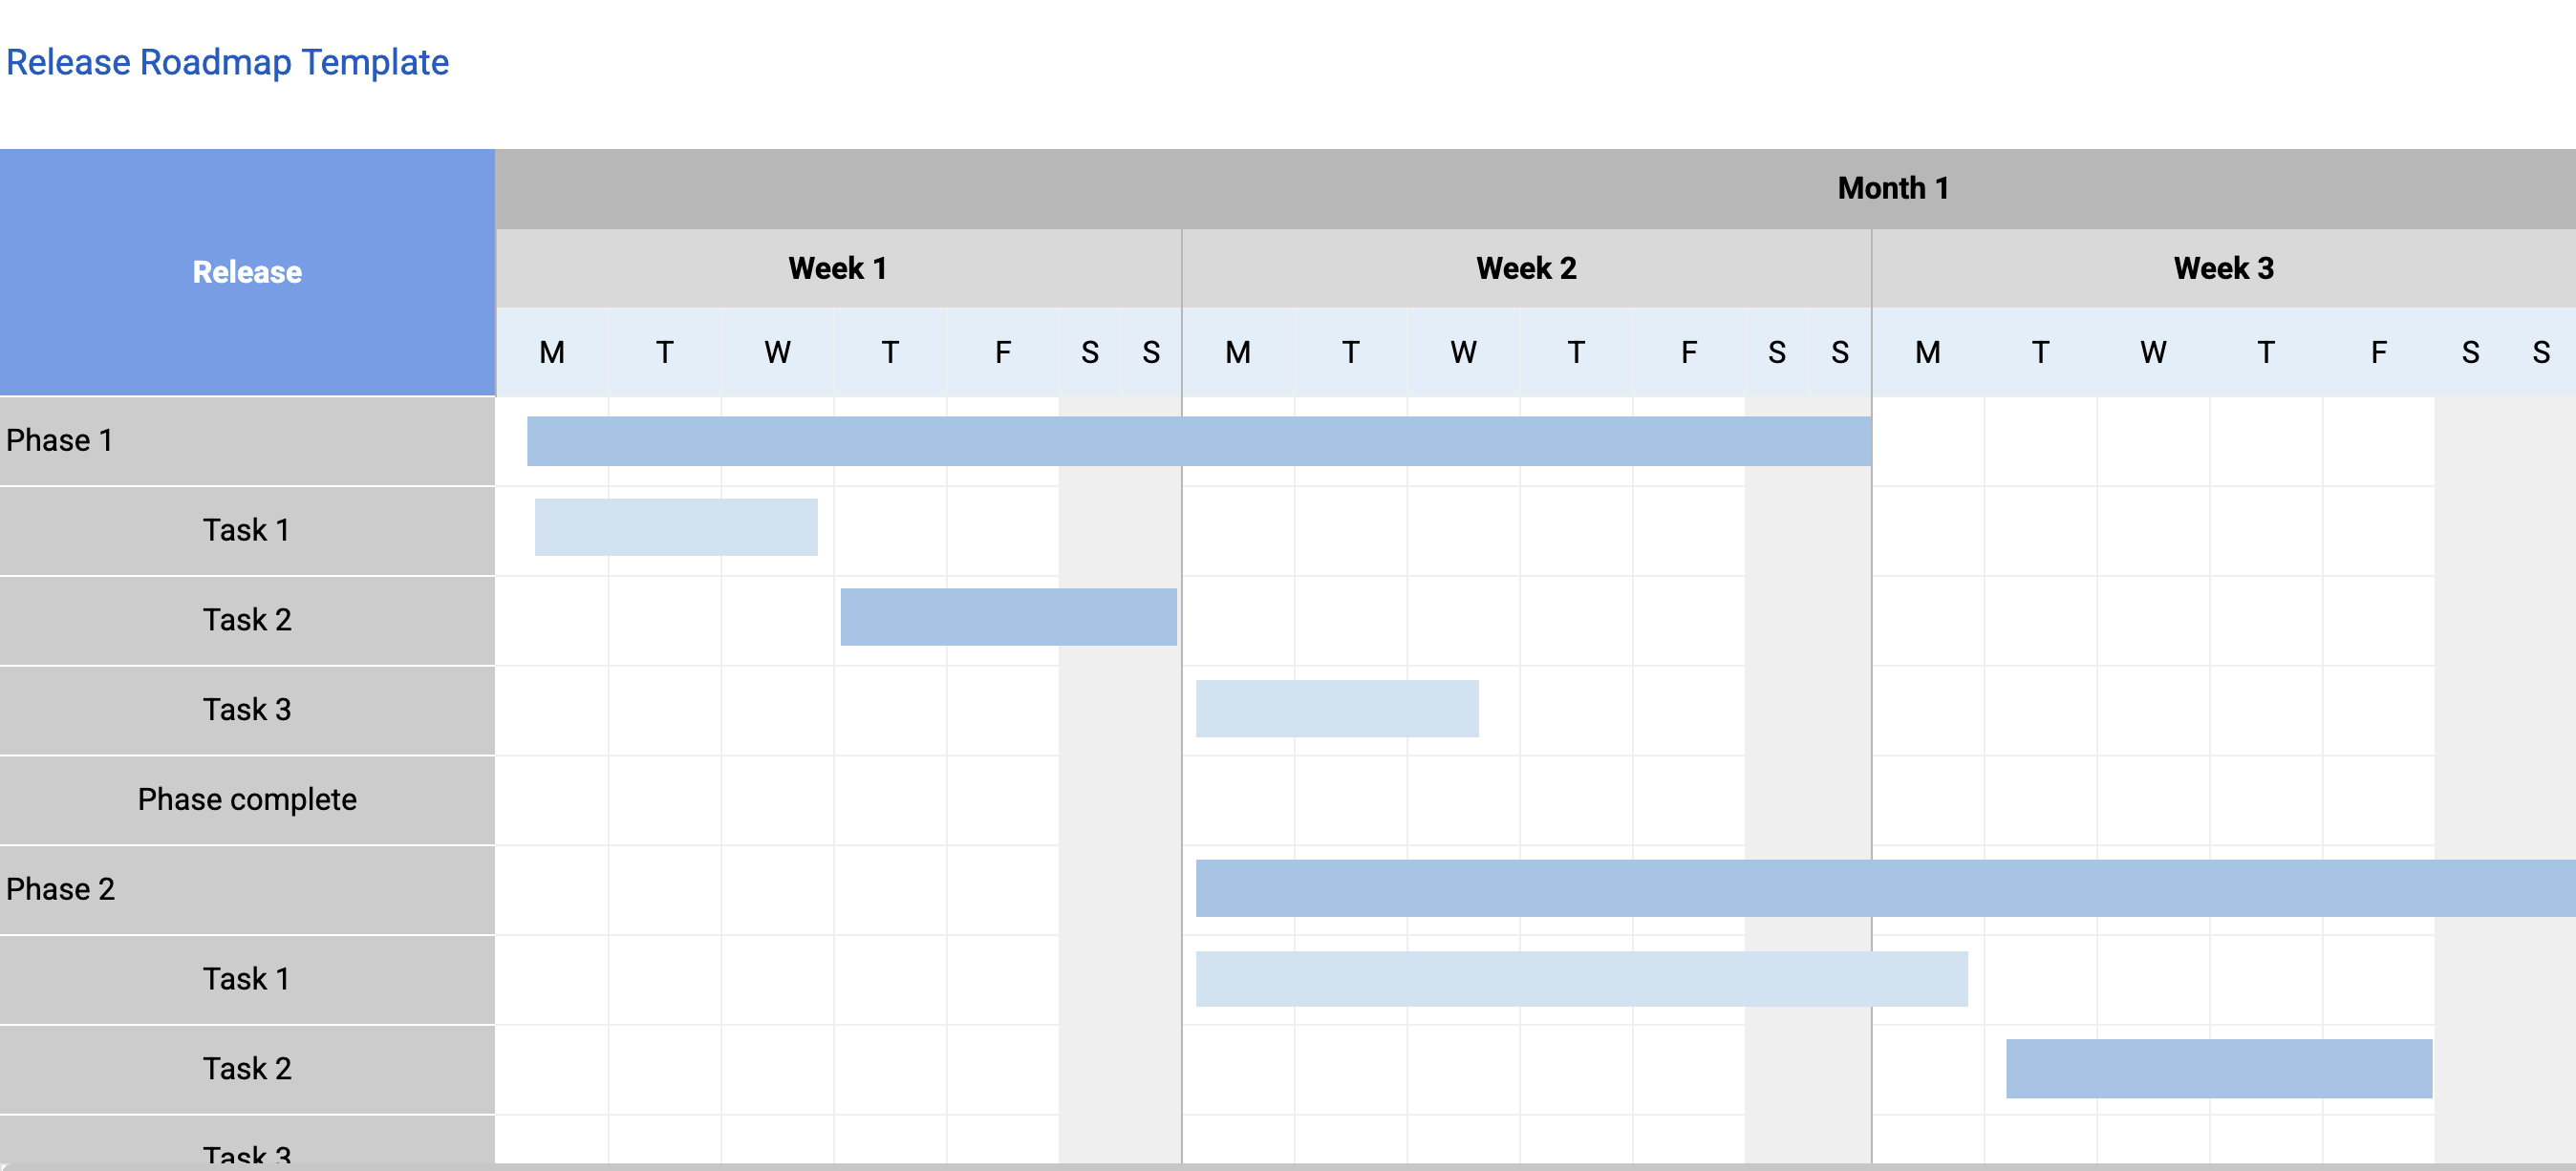
The Release Roadmap Template structures your roadmap around release milestones, with feature lists, owners, and status tracking per release.
Now/Next/Later roadmaps
Three columns representing immediacy: what the team is working on now, what comes next, and what is further out. No dates, no sprints. Just relative priority. This is the most agile-friendly format because it explicitly avoids false precision.
Best for: Teams that want to communicate direction without committing to dates. The Now/Next/Later guide covers this format in depth.
Drawbacks: Stakeholders who want specific dates will push back.
Setting Up Your Agile Roadmap in Google Sheets
Whatever format you pick, the setup follows the same pattern: define your columns, add data validation, apply conditional formatting, and connect it to your backlog.
Core columns for any agile roadmap
| Column | What it captures | Example values |
|---|---|---|
| Epic/Feature | The unit of work | "User onboarding redesign" |
| Owner | Who drives it | "Alex (Eng Lead)" |
| Status | Current state | Backlog, In Progress, In Review, Done |
| Priority | Stack rank or tier | P0, P1, P2 |
| Sprint/Release | When it ships | Sprint 14, v2.3, Q2 |
| Story Points | Size estimate | 1, 2, 3, 5, 8, 13 |
| Theme | Strategic bucket | Growth, Tech Debt, Infrastructure |
| Acceptance Criteria | Definition of done | Link to spec or inline |
Set up dropdown menus for Status, Priority, Sprint/Release, and Theme using Data → Data validation. This keeps the data filterable and prevents "in progress" vs "In Progress" vs "WIP" inconsistencies that break your formulas later.
Conditional formatting for status visibility
Apply color coding to make the roadmap scannable at a glance:
- Backlog → Light gray
- In Progress → Yellow
- In Review → Light blue
- Done → Green
- Blocked → Red
Select the Status column, go to Format → Conditional formatting, and add a rule for each value. Apply the same approach to Priority (red for P0, orange for P1, default for P2).
Freeze rows and columns
Freeze your header row (View → Freeze → 1 row) and the first column (View → Freeze → 1 column) so feature names and column headers stay visible as the roadmap grows. This matters more than it sounds. A roadmap you cannot read is a roadmap nobody uses.
Managing Your Backlog in Google Sheets
In agile, the backlog is the roadmap's engine. Everything on the roadmap either comes from the backlog or feeds back into it. Here is how to connect the two in Sheets.
Separate tab for the backlog
Keep your roadmap view and your backlog in separate tabs within the same spreadsheet:
- Roadmap tab: The curated view you share with stakeholders. Only committed or high-confidence items.
- Backlog tab: Everything. Feature requests, bug reports, tech debt, ideas from customer calls. Unfiltered, unsorted, growing constantly.
The backlog tab should have columns for: Item, Source (who requested it), Date Added, Category, Priority Score, and Status (New, Triaged, Promoted to Roadmap, Won't Do).
Prioritization scoring in the backlog
Add RICE scoring columns to your backlog to make prioritization decisions visible and debatable:
Reach (users/quarter): 500
Impact (1-3): 3
Confidence (%): 80
Effort (person-weeks): 2

RICE Score = (500 × 3 × 0.8) / 2 = 600
The formula in Google Sheets:
=((B2 * C2 * D2) / E2)Sort the backlog by RICE score descending to surface the highest-value work. The RICE Calculator can help you calibrate scores consistently across items before entering them in the sheet.
If RICE feels too heavy for your team, try MoSCoW prioritization. It sorts items into Must Have, Should Have, Could Have, and Won't Have without requiring numerical scoring. The MoSCoW tool generates the categorization for you.
Promoting items from backlog to roadmap
When an item scores high enough or gets executive sponsorship, promote it:
- Change its status in the backlog tab to "Promoted to Roadmap"
- Add it to the roadmap tab with the appropriate sprint/release assignment
- Link back to the backlog row using a cell reference or hyperlink so you can trace the origin
This two-tab approach keeps your roadmap clean for stakeholders while preserving the full context of how items got there.
Formulas That Make Agile Roadmaps Work
A few formulas turn your spreadsheet from a static list into a live dashboard.
Sprint velocity tracking
If you track story points, calculate velocity per sprint:
=SUMIFS(PointsColumn, SprintColumn, "Sprint 14", StatusColumn, "Done")Track this across sprints to build a velocity trend. After 4-5 sprints, you will have a reliable average that helps you plan capacity for future sprints. The Sprint Velocity Calculator automates this tracking and charts your trend over time.
Burndown data
Create a simple burndown by tracking remaining points per day or per sprint:
Total Points: =SUM(PointsColumn)
Completed Points: =SUMIF(StatusColumn, "Done", PointsColumn)
Remaining: =Total - Completed
Plot these in a line chart (Insert → Chart) for a visual burndown that updates automatically as items move to Done.
Status summary dashboard
Add a summary section at the top of your roadmap tab:
Total Items: =COUNTA(A2:A)
In Progress: =COUNTIF(StatusColumn, "In Progress")
Blocked: =COUNTIF(StatusColumn, "Blocked")
Done This Sprint: =COUNTIFS(StatusColumn, "Done", SprintColumn, "Sprint 14")
Completion Rate: =COUNTIF(StatusColumn, "Done") / COUNTA(A2:A)
These five numbers give anyone a pulse check on the roadmap without reading every row.
Effort distribution by theme
Understand where your team's effort is going:
Growth: =SUMIFS(PointsColumn, ThemeColumn, "Growth", StatusColumn, "<>Backlog")
Tech Debt: =SUMIFS(PointsColumn, ThemeColumn, "Tech Debt", StatusColumn, "<>Backlog")
Infrastructure: =SUMIFS(PointsColumn, ThemeColumn, "Infrastructure", StatusColumn, "<>Backlog")
If tech debt is eating 40% of your capacity but leadership thinks it is 10%, this formula makes the conversation concrete.
Connecting Your Roadmap to Strategy
An agile roadmap without strategic context is a feature list. Connecting features to goals makes the roadmap useful for stakeholder conversations.
Add a goals layer
Create a separate tab or section that maps strategic goals to roadmap items:
| Goal | Key Result | Roadmap Items | Progress |
|---|---|---|---|
| Improve activation rate | 60% → 80% trial-to-paid | Onboarding redesign, In-app guides | 2/4 shipped |
| Reduce churn | 5% → 3% monthly | Health scoring, Proactive outreach | 1/3 shipped |
The Progress column uses a formula like:
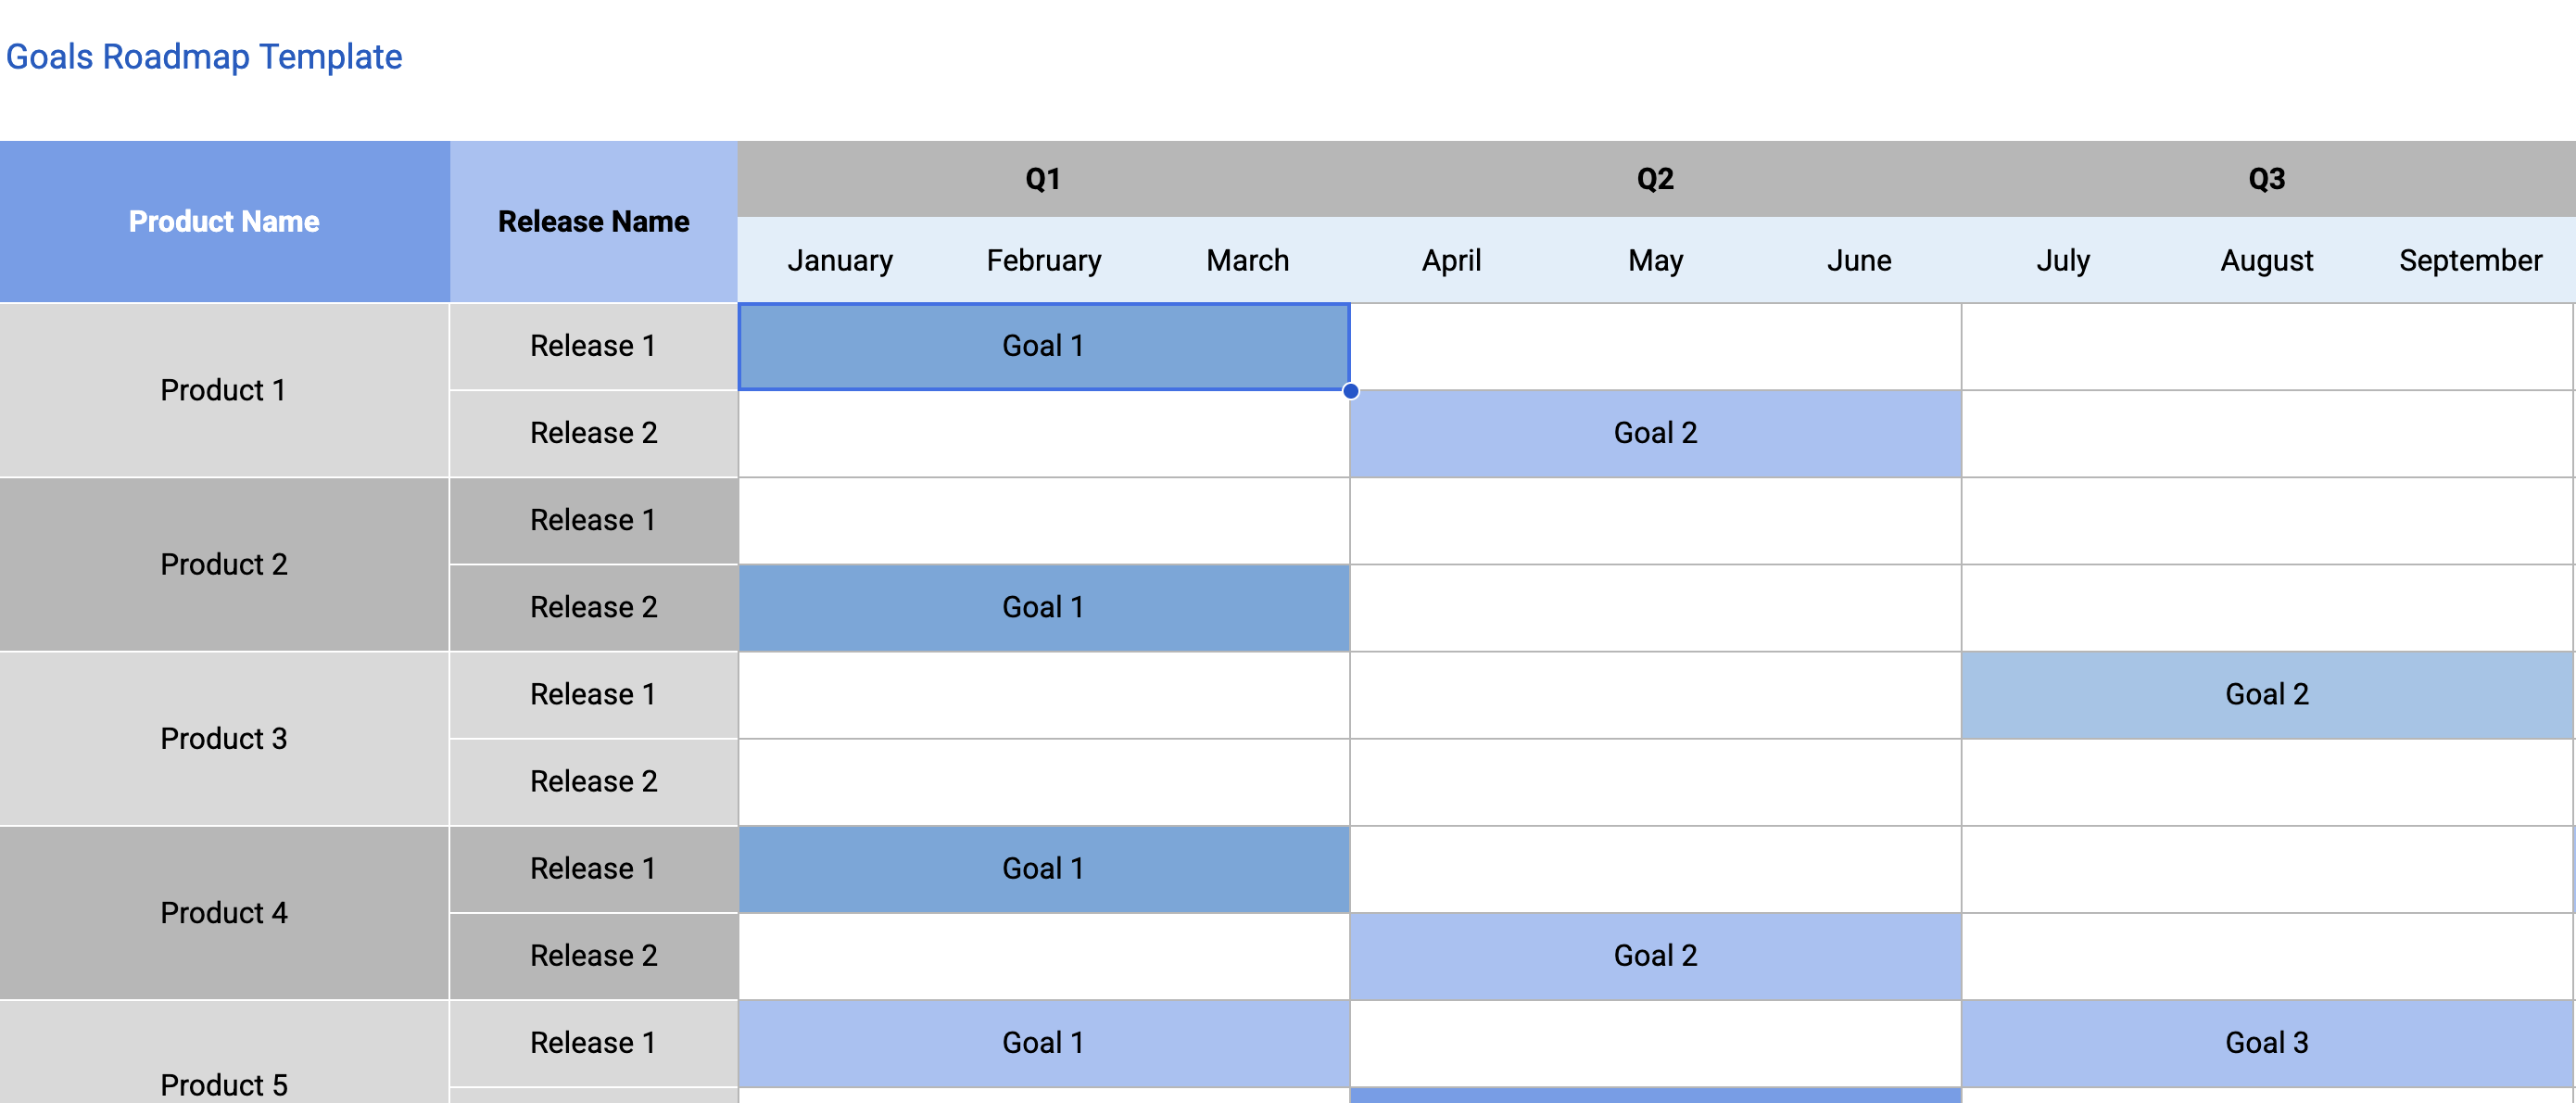
=COUNTIFS(GoalColumn, "Improve activation", StatusColumn, "Done") & "/" & COUNTIF(GoalColumn, "Improve activation")This is the structure behind goals-based roadmaps. For a ready-made version, the Goals Roadmap Template has this layout pre-built.
Initiative-level grouping
For teams managing multiple workstreams, group features under initiatives. An initiative is bigger than a feature but smaller than a goal. Something like "Self-serve onboarding" that spans 4-6 features across 2-3 sprints.
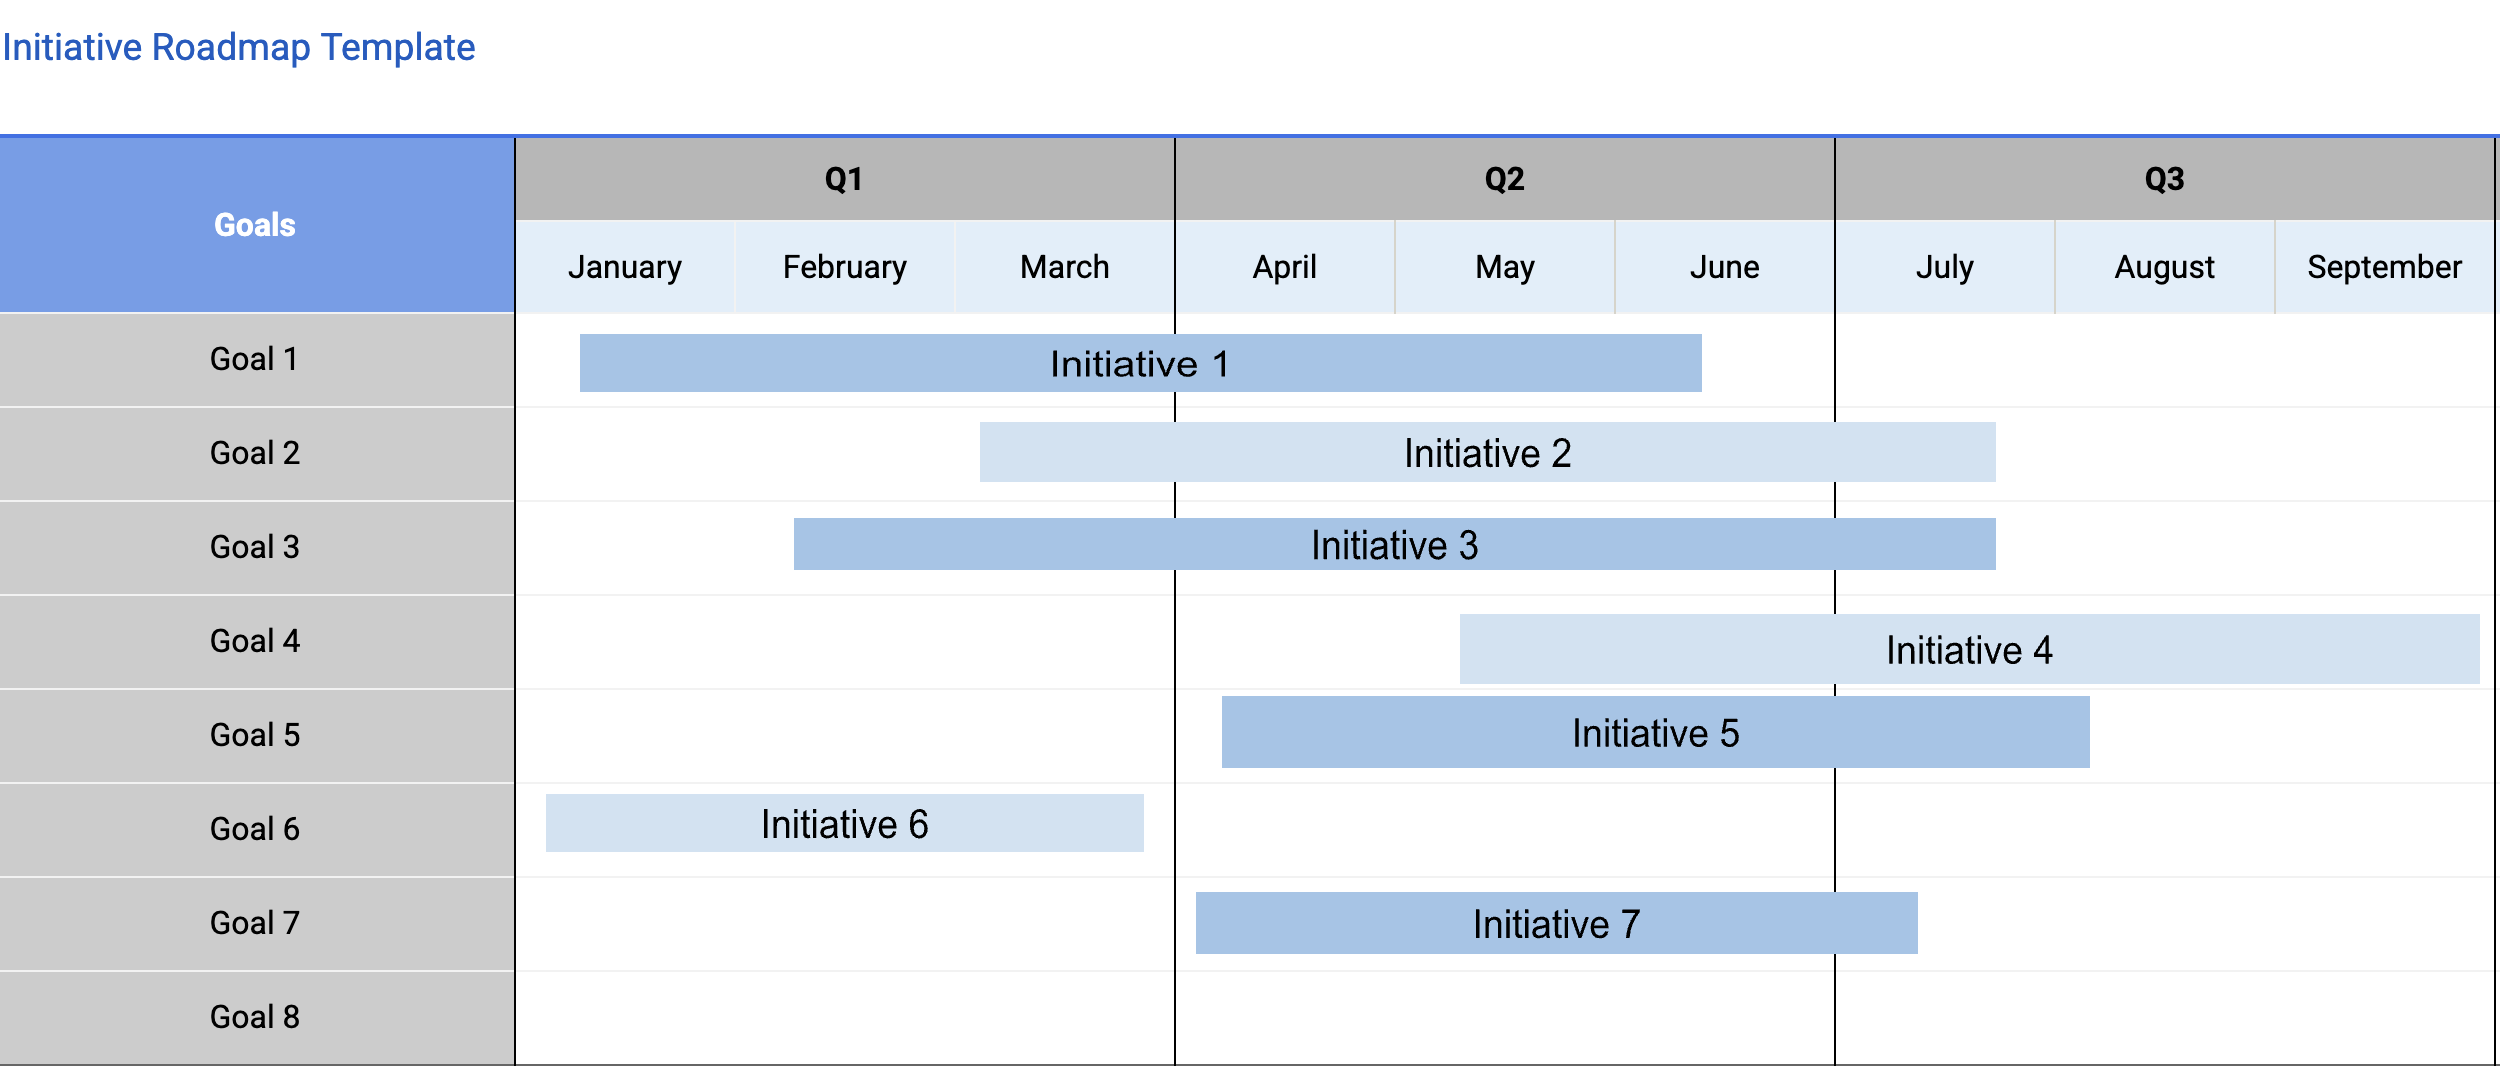
The Initiative Roadmap Template and Product Initiative Template both handle this grouping, with different levels of cross-functional detail.
Portfolio view for multi-product teams
If you manage multiple products or product lines, a portfolio-level roadmap shows where investment is going across the portfolio.
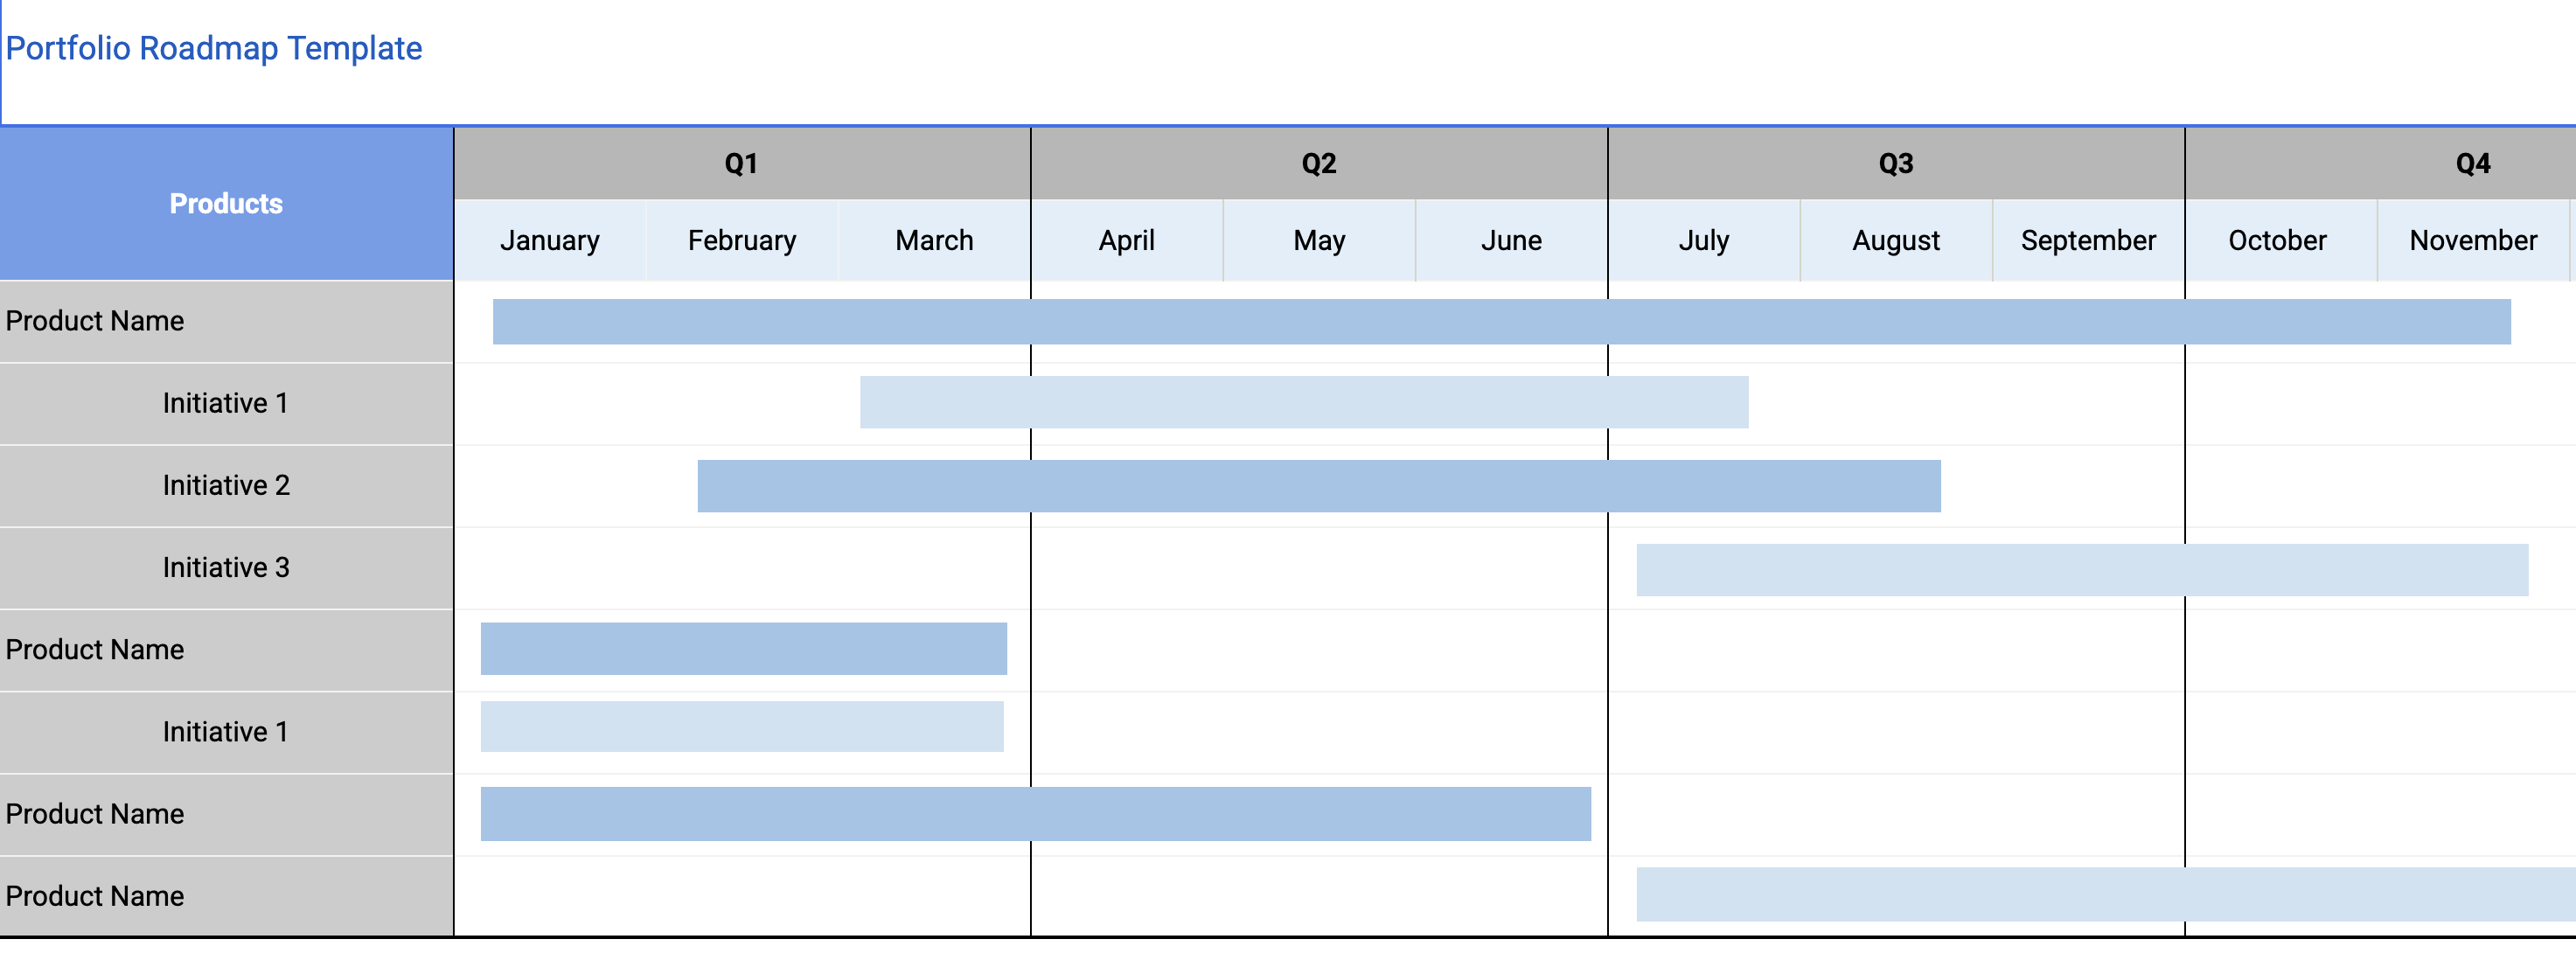
The Portfolio Roadmap Template gives you this view. See portfolio roadmaps for when you need one.
Free Agile Roadmap Templates for Google Sheets
Rather than building from scratch, start with one of these templates and customize it for your team:
For sprint-based teams
- Epic Roadmap Template. Track epics across sprints with status, priority, and team assignments. The closest thing to a Jira board in spreadsheet form.
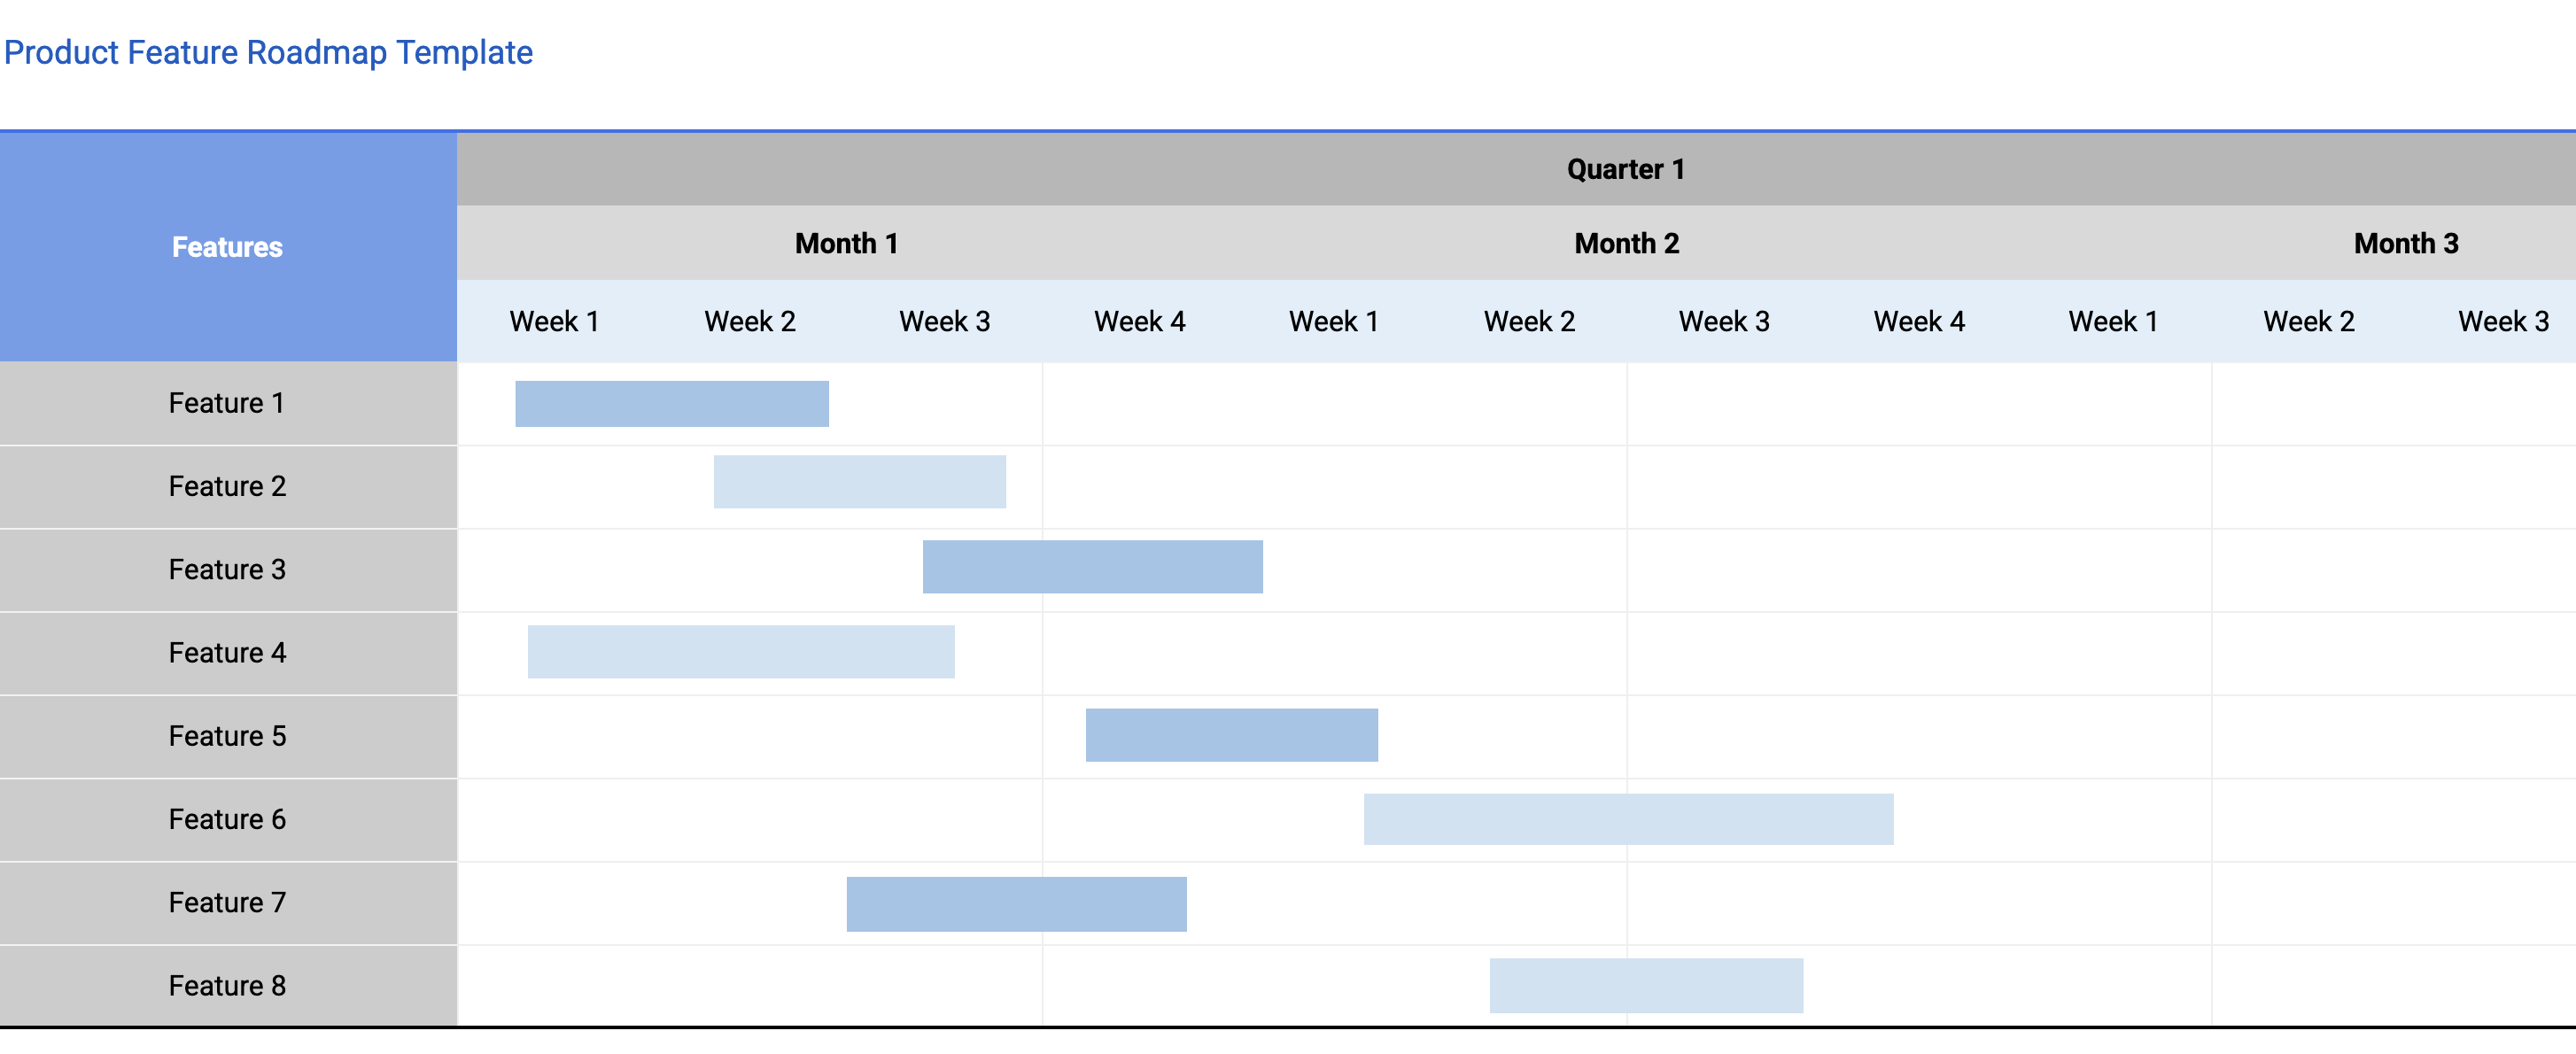
- Product Feature Roadmap Template. Feature-level planning with effort estimates and impact scores. Good for teams that plan at the feature level rather than the epic level.
For continuous delivery teams
- Kanban Roadmap Template. Workflow columns with WIP limits. No sprints, no fixed iterations. Items flow when they are ready.
- Release Roadmap Template. Organized by release milestones for teams that batch work into versioned releases.
For strategic planning
- Goals Roadmap Template. Map features to strategic objectives. Best for executive communication and quarterly planning.
- Initiative Roadmap Template. Group features into initiatives with owners and timelines. The sweet spot between feature-level and goal-level planning.
All templates are Google Sheets files you can copy to your own Drive and start editing immediately. They include conditional formatting, data validation, and the column structures described in this guide. If your team uses a specific tool alongside Sheets, see the dedicated template guides for Jira teams, Linear teams, and Notion teams.
For slide-based roadmaps to use in stakeholder presentations, check out the Google Slides roadmap templates. And if you want to level up your roadmapping practice beyond templates, 50 product roadmap best practices covers the strategy and stakeholder management side.
Google Sheets Roadmap Template Best Practices
A Google Sheets roadmap template is only as useful as the habits your team builds around it. These practices separate teams that get real value from spreadsheet roadmaps from those that abandon them within a month.
Design for your audience, not your process
The most common mistake is building a roadmap template that reflects your internal process but confuses stakeholders. Engineering teams want sprint-level detail with story points and blockers. Executives want strategic themes and quarterly progress. Build separate tabs or filtered views for each audience within the same Google Sheets roadmap template rather than forcing everyone to parse the same dense view.
Use color sparingly and consistently
Conditional formatting turns a spreadsheet into a visual dashboard, but too many colors create noise. Limit yourself to five colors maximum: one for each status (Backlog, In Progress, Blocked, Done) plus one highlight color for items that need attention this week. Apply the same color scheme across all tabs and templates in your spreadsheet. Inconsistent color coding across different views forces readers to re-learn the visual language every time they switch tabs.
Version your roadmap with snapshots
Google Sheets lacks built-in version comparison for planning purposes. Create a "Snapshots" tab where you paste a copy of your roadmap at the end of each month or quarter. Label each snapshot with the date. This gives you a record of how the roadmap evolved and helps answer questions like "when did we deprioritize feature X?" during retrospectives. The roadmap best practices guide covers more techniques for maintaining roadmap integrity over time.
Set up automated notifications
Use Google Sheets' built-in notification rules (Tools > Notification rules) to alert you when someone edits the roadmap. For more granular control, a simple Google Apps Script can send Slack messages when specific cells change. For example, posting to a Slack channel whenever an item's status changes to "Blocked." This keeps the team informed without requiring everyone to check the spreadsheet daily.
Pair templates with the right roadmap type
Not every Google Sheets roadmap template fits every team. Match your template to your planning style: sprint-based teams benefit from the Epic Roadmap Template with sprint columns, while teams practicing continuous delivery should start with the Kanban Roadmap Template. Teams focused on outcome-based planning are better served by the Goals Roadmap Template which maps features to strategic objectives rather than timeframes, paired with the OKR tracker in Google Sheets for scoring those objectives each cycle.
Keeping Your Agile Roadmap Current
The biggest failure mode for spreadsheet roadmaps is staleness. An outdated roadmap is worse than no roadmap. It actively misleads stakeholders.
Build updates into your ceremonies
- Sprint planning: Update the roadmap tab to reflect what is committed for the upcoming sprint. Move anything that slipped.
- Sprint review/retro: Mark completed items as Done. Update the velocity tracker. Adjust future sprint assignments based on what you learned. Use the Release Notes Generator to draft a summary of what shipped.
- Backlog refinement: Re-score backlog items using RICE or whatever framework you use. Promote high-scorers to the roadmap. Archive items that have been sitting untouched for 3+ months.
For a structured approach to feeding customer insights into these ceremonies, see the continuous discovery habits guide.
Use named ranges and filters
As your roadmap grows past 30-40 items, use Google Sheets' filter views (Data → Create a filter) so different team members can slice the roadmap without changing what others see. Create saved filter views for:
- My items: Filtered by Owner = current user
- This sprint: Filtered by Sprint = current sprint
- Blocked: Filtered by Status = Blocked
- By theme: Filtered by Theme = selected theme
Named ranges (Data → Named ranges) make your formulas readable. =COUNTIF(Status, "Done") is easier to maintain than =COUNTIF(D2:D500, "Done"). For more techniques like pivot tables, conditional formatting rules, and data validation patterns, see advanced Google Sheets workflows for PMs.
Know when to upgrade
Google Sheets handles agile roadmaps well for teams up to about 50 people managing fewer than 100 roadmap items. Beyond that, you will start hitting friction:
- Manual status updates drift from reality as the team grows
- Dependency tracking between items requires workarounds that break
- Multiple product lines in one sheet becomes unwieldy
When you hit these limits, the PM Tool Picker helps match your team to the right roadmap tool, and the PM software directory compares 40 tools across categories. But do not switch prematurely. A well-maintained spreadsheet beats a poorly adopted enterprise tool every time.
Explore More
- Top 8 Agile Frameworks for Product Teams (2026) - 8 agile frameworks compared side by side for product teams.
- Top 15 Free Product Management Templates (2026) - 15 free PM templates covering roadmaps, PRDs, strategy docs, sprint plans, and retrospectives.
- Top 10 Roadmap Tools and Templates (2026) - The 10 best roadmap tools and templates for product managers in 2026.
- Top 10 AI Tools for Product Managers (2026) - 10 AI-powered tools that save product managers hours every week.