Quick Answer (TL;DR)
Measure product roadmap success by tracking a mix of leading indicators (feature adoption, sprint velocity, time-to-value) and lagging indicators (ROI, churn, NPS). Align every roadmap item to a specific business goal using OKRs, review metrics quarterly, and focus on actionable outcomes like customer problem resolution rather than vanity metrics like features shipped.
A product roadmap is only as good as the results it delivers. To ensure your roadmap drives meaningful outcomes, you need to align it with business goals, track the right metrics, and regularly review progress. Here's what you need to know:
- Set measurable goals: Use frameworks like SMART or OKRs to define clear objectives tied to business priorities.
- Track relevant KPIs: Combine leading indicators (e.g., feature adoption) with lagging indicators (e.g., ROI) to measure both short-term progress and long-term impact.
- Monitor team execution: Use agile metrics like sprint velocity and cycle time to identify bottlenecks and improve delivery.
- Focus on customer outcomes: Metrics like Time to First Value (TTFV) and Net Promoter Score (NPS) show how well your product meets user needs.
- Use AI tools: Automate KPI tracking and gain predictive insights to save time and enhance decision-making.
Align Roadmap Goals with Business Objectives
Define Clear, Measurable Objectives
To create a roadmap that truly delivers, you need goals that are both specific and measurable. If you have not yet built your roadmap, start with our step-by-step guide to building a product roadmap before defining your measurement framework. Frameworks like SMART or OKRs can help you set clear targets, complete with numbers and deadlines, to define what success looks like.
Research consistently shows that professionals who set vague goals without measurable outcomes are far less likely to achieve them. Let’s say your goal is customer-focused - be specific, like aiming to "reduce trial time-to-value to 10 days." For business-focused objectives, go beyond vague intentions like "increase revenue" and commit to something concrete, like "+20% revenue growth in 12 months". As Peter Drucker wisely put it:
"You can't manage what you can't measure".
To stay effective, narrow your focus to just three to five product goals per planning period. This ensures your team’s efforts aren’t spread too thin. For goals that are harder to measure directly - like Customer Lifetime Value - use leading indicators such as Day-7 engagement or Average Revenue Per User to track early progress.
Once you've nailed down your objectives, every item on your roadmap should directly support these priorities. The quarterly business review template helps you present roadmap performance, key metrics, and strategic alignment to leadership in a structured format.
Link Roadmap Items to Business Priorities
Each roadmap item must tie back to a specific business priority. Think of it as a chain: business goals shape product goals, which guide initiatives, and those initiatives lead to specific features.
This approach keeps your team focused. If a stakeholder proposes a flashy but unrelated feature, you can objectively assess whether it aligns with your established goals. Annie Dunham, Product Leader at Pendo, captures this perfectly:
"Objectives should always come before strategy".
Before diving into major commitments, validate your initiatives with small-scale experiments to ensure they’re worth the investment. This way, your roadmap remains a powerful tool for driving meaningful progress.
sbb-itb-7c23fa1
Select Key KPIs for Roadmap Tracking
Choose Leading and Lagging Indicators
To effectively track your roadmap, you need a mix of leading indicators - like sprint velocity, feature adoption, or time-to-value - and lagging indicators that reflect outcomes such as revenue, churn rates, and ROI. Rachel Torres, Former Group Product Marketing Manager at Amplitude, puts it this way:
"Leading indicators predict what will happen in the immediate future. They're close to your product organization's day-to-day work, and your team can directly impact them."
Interestingly, organizations that achieve over 90% of their quarterly objectives are three times more likely to use cascading OKRs that balance both types of indicators. The takeaway? Don’t rely on just one category. Leading indicators help you make adjustments early, while lagging indicators confirm the long-term impact of your efforts.
This balance is crucial when selecting KPIs for different stages of your roadmap.
Examples of Relevant KPIs
When planning, focus on metrics like the percentage of ideas tied to strategic goals (aim for at least 70%) and stakeholder alignment. During execution, keep an eye on sprint burndown rates, time-to-market, and adherence to release cycles, targeting an 80%+ success rate.
For customer impact, track metrics like feature adoption rate to see if users are engaging with what you've built and time-to-value (TTV) to measure how quickly customers benefit from your product. A Net Promoter Score (NPS) over 50 is a strong indicator of customer loyalty. And for business impact, ROI is a key metric, with well-structured roadmaps often delivering returns between 200% and 300%.
A great case study comes from Primephonic, which, in 2019, shifted its North Star metric from "Monthly Active Users" to "Media Minutes Consumed." By prioritizing roadmap features that reduced friction in playing music - like adding a "Radio" feature - they boosted their signup-to-completion conversion rate from 20% to nearly 80%. This shows how choosing the right KPI can transform outcomes.
Avoid vanity metrics like the total number of features shipped or lines of code written - they rarely lead to actionable insights.
Measure Execution and Team Performance
Track Agile Metrics
Once you've chosen your KPIs, the next step is to evaluate how well your team is executing the roadmap. Tools like sprint velocity and burndown charts are excellent for predicting capacity and monitoring sprint progress. Keep in mind that velocity is unique to each team, so it’s best used internally to forecast workloads rather than for comparing across teams.
Cumulative Flow Diagrams (CFDs) are another valuable tool, offering a visual breakdown of work stages to identify areas where tasks might be piling up. For example, a noticeable gap between "In Progress" and "Done" could point to resource constraints or dependency issues.
Maintaining a healthy backlog is also critical to smooth execution. Aim to have at least 60% of backlog items clearly defined, estimated, and prioritized to avoid delays. Additionally, implementing Work in Progress (WIP) limits can minimize context-switching and help maintain a steady workflow.
These agile metrics do more than track progress - they also reveal process inefficiencies, paving the way for improved delivery.
Identify Bottlenecks and Improve Delivery
Agile metrics like cycle time and lead time are particularly useful for spotting inefficiencies. Cycle time measures how quickly tasks are completed, while lead time tracks the overall duration from start to finish. Shortening these times is a clear sign that your team is becoming more efficient.
For inspiration, consider Vanguard's modernization initiative, launched in 2020 under CTO Mike Carr. By shifting from project-based work to permanent product teams and enhancing Agile practices and CI/CD pipelines, Vanguard achieved a fivefold increase in technology change rates and a 75% reduction in major incidents. Similarly, NatWest Group used cascading OKRs and Planview to align strategy with delivery across a $1 billion annual investment portfolio. This approach resulted in a fivefold increase in funding speed and approximately $20 million in annual savings.
Retrospectives are an ideal time to use these metrics to pinpoint bottlenecks. For example, a defect escape rate exceeding 5% suggests that testing processes need improvement. High-performing teams often rely on cascading OKRs and flow metrics to keep operations running smoothly and efficiently.
Assess Product and Customer Outcomes
Measure Customer Impact
When it comes to understanding success, customer outcomes should take center stage. Metrics that focus on customer impact reveal the true value of your product - not just how well your team executes. It’s not about the number of features you release; it’s about the results your users achieve.
Some of the most telling customer success metrics include Time to First Value (TTFV), which measures how quickly users experience the core benefit of your product; Goal Completion Rate, which tracks how often users successfully complete key actions; and Feature Adoption Depth, which shows how deeply users engage with high-value features. For instance, if you’re improving onboarding, a shorter TTFV is a clear indicator of success. Similarly, if you’ve launched a new analytics dashboard, you’ll want to know whether users are simply viewing it or actively creating custom reports and sharing insights. Retention by Cohort adds another layer of insight by comparing whether users who engage with a specific roadmap initiative stay active longer than those who don’t.
Sentiment metrics like NPS (Net Promoter Score), CSAT (Customer Satisfaction Score), and CES (Customer Effort Score) are also essential for gauging user loyalty. CES, for example, is 40% more effective at predicting customer loyalty than CSAT. On the flip side, 96% of customers who endure high-effort interactions report future disloyalty. As Mario Queiroz, Chief Product Officer at Hinge Health, aptly notes:
"For the user, it's all about the outcomes. Are they relieving their pain? They pay for that".
While these customer-focused metrics validate user success, they also set the stage for assessing how these improvements contribute to long-term business growth.
Validate Business Impact
Once you’ve confirmed that your product delivers value to customers, the next step is to evaluate the financial impact on your business. Metrics like ROI (Return on Investment), Payback Period, and Net Renewal Rate (NRR) are critical for determining whether your roadmap is driving growth. For example, calculating how long it takes for the profits from a new feature to offset its development costs offers a clear picture of financial success. In fact, top-performing SaaS companies with $15. 30M in annual recurring revenue typically achieve an NRR between 115. 120%.
A great example of this comes from BMW Group’s IT department, which completed an integration project a full year ahead of schedule by using value stream insights. This demonstrates how aligning your roadmap with strategic business goals can result in measurable ROI. Additionally, tracking metrics like Annual Recurring Revenue (ARR), Customer Acquisition Cost (CAC), and Customer Lifetime Value (LTV) ensures that your product roadmap doesn’t just delight users - it also fuels sustainable business growth.
Use AI Tools for KPI Tracking
Automate Roadmap Performance Monitoring
Manually collecting metrics can be a major time drain, pulling focus away from making strategic decisions. AI tools can change the game by integrating natively with platforms like Google Analytics, HubSpot, and CRMs. These tools automatically consolidate and standardize metrics, eliminating the need for manual input. Dashboards refresh every 15 minutes, ensuring you're always working with the most current data. But it’s not just about speed - AI tools also deliver predictive insights that traditional methods simply can’t match.
For instance, AI-powered analysis processes customer feedback up to six times faster than standard approaches. Additionally, using AI during the product definition phase can cut the time to a roadmap-ready state by 50% to 75%. Organizations using AI for KPI tracking are five times more likely to align incentive structures with their business goals compared to those relying on outdated metrics. François Candelon of the BCG Henderson Institute explains:
"AI can reveal novel layers of insight by exploring and connecting data in ways beyond the reach of even the savviest of managers".
AI tools also excel at uncovering hidden drivers of performance and connections between metrics, producing KPIs that are more accurate and forward-looking than those generated by traditional methods. For subjective assessments, like evaluating feature relevance or user experience, AI auto-raters analyze performance against pre-defined benchmarks.
Scale Product Management with AI
AI doesn’t just streamline monitoring - it scales the entire product management process. Tools like IdeaPlan enable product teams to achieve exponential results through automation and pre-designed templates. These templates automatically track critical metrics like churn rate, Net Promoter Score (NPS), and time-to-market. By integrating these insights directly into your roadmap, AI ensures your strategies are always tied to measurable outcomes.
IdeaPlan goes a step further by enabling teams to build shared prompt libraries for tasks like requirements gathering, user stories, and competitive analysis. This standardizes roadmapping across teams, making the process more efficient. The impact is clear: teams using AI for requirements and user stories report fewer clarification questions during development. Additionally, IdeaPlan’s AI keeps a running log of product friction points, automatically adjusting roadmap priorities. This ensures that at least 70% of roadmap initiatives are aligned with strategic company goals rather than reactive fixes.
As Teravision Technologies aptly puts it:
"AI can see patterns, but only you can recognize meaning".
This balance between AI-driven automation and human expertise ensures that every decision contributes to meaningful, measurable outcomes.
How to Build a Roadmap for Success by eBay Director of Product

Review and Iterate on Roadmap Metrics
Vanity Metrics vs Actionable Metrics for Product Roadmaps
Conduct Quarterly Metric Reviews
Once you've set your KPIs, regular reviews are essential to keep your roadmap aligned with changing business goals. Business objectives can shift, and consistent reviews help ensure your metrics stay relevant and aligned with stakeholder priorities. Interestingly, more than two-thirds of product managers revise their roadmaps at least monthly, with weekly updates being the most common schedule.
To keep things on track, establish a structured review cadence. This could include daily stand-ups for execution updates, monthly reviews to analyze trends, and Quarterly Business Reviews (QBRs) to ensure strategic alignment. Elite organizations - those achieving over 90% of their quarterly objectives - are three times more likely to employ cascading OKRs, which link enterprise goals directly to product-level objectives. These structured practices not only speed up funding decisions but also minimize the burden of outdated systems.
When introducing a new metric, take 3. 4 months to gather initial data and establish a baseline before measuring progress. As Annie Dunham from ProductPlan wisely points out:
"Missed metrics are an indication that it's time to adjust, not necessarily time to start over".
Once you've built a habit of regular reviews, shift your attention to metrics that drive actionable decisions.
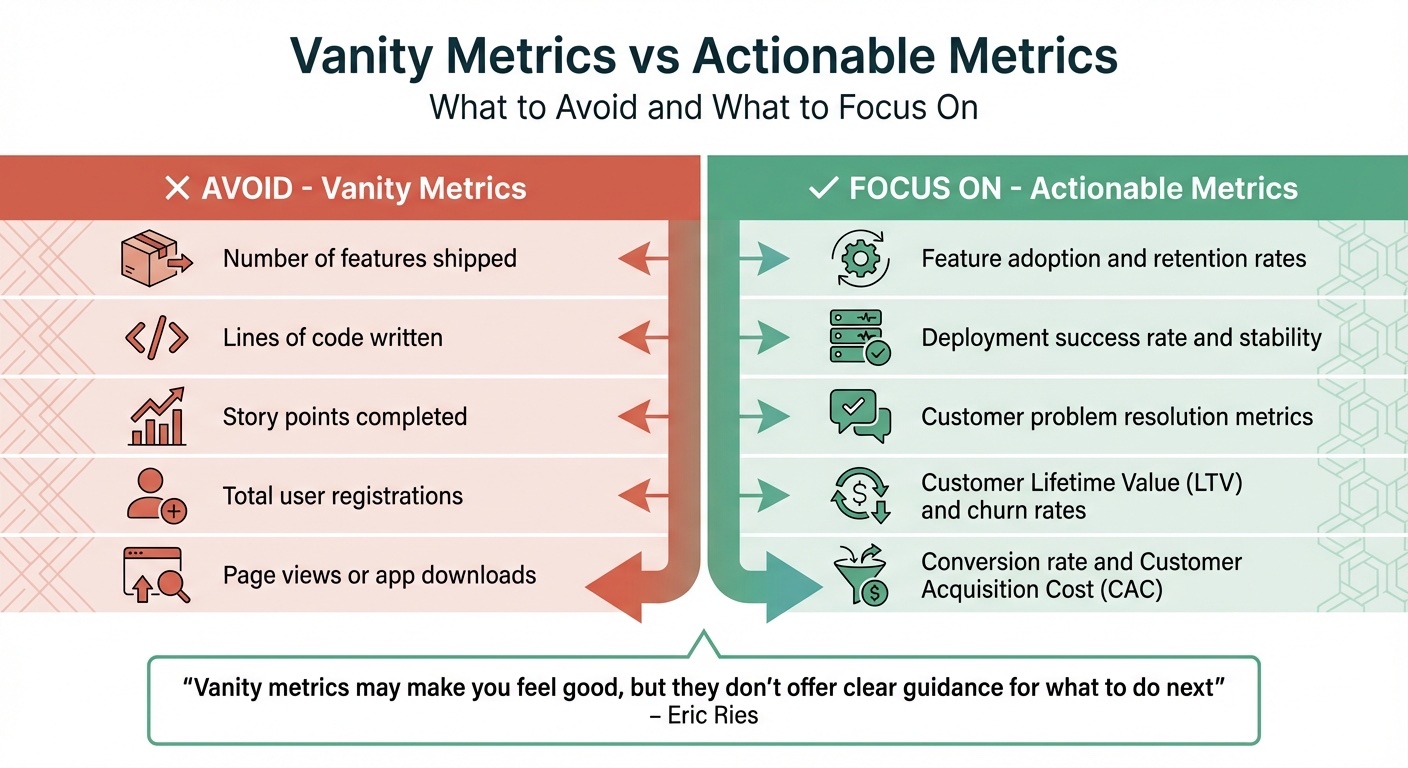
Focus on Actionable Metrics, Not Vanity Metrics
Metrics like total downloads or lines of code might look impressive, but they often fail to provide actionable insights. As Eric Ries, author of The Lean Startup, puts it:
"Vanity metrics may make you feel good, but they don't offer clear guidance for what to do next".
Instead of focusing on outputs like features launched, prioritize outcomes such as feature adoption or solving customer pain points. For example, when Vanguard transitioned in 2020 from project-based metrics to product-focused ones, they achieved a fivefold increase in technology change rates while cutting major incidents by 75%. The difference? They stopped tracking story points and started monitoring metrics like deployment success rates and customer problem resolution.
Here’s a quick comparison to guide your focus:
| Avoid | Focus On |
|---|---|
| Number of features shipped | Feature adoption and retention rates |
| Lines of code written | Deployment success rate and stability |
| Story points completed | Customer problem resolution metrics |
| Total user registrations | Customer Lifetime Value (LTV) and churn rates |
| Page views or app downloads | Conversion rate and Customer Acquisition Cost (CAC) |
Conclusion: Drive Success Through Measurable Roadmaps
Key Takeaways
Creating a successful product roadmap goes beyond merely rolling out features - it’s about achieving measurable results that align directly with your business goals. Research shows that clearly defined KPIs can reduce time-to-market by as much as 40% while boosting profitability. These figures highlight the importance of focusing on measurable outcomes.
Your roadmap should prioritize goals that directly support your company’s strategic objectives, with at least 70% of ideas contributing to these goals. To achieve this, combine hard data with qualitative insights for a well-rounded view. Focus on metrics that matter, like feature adoption rates and how effectively customer problems are being solved, rather than relying on vanity metrics that don’t drive real value.
Consistency is key. Set up a regular review schedule - daily stand-ups for execution, monthly reviews for analyzing trends, and quarterly sessions for strategic alignment. This ensures your roadmap stays adaptable as market conditions evolve. When team objectives are tightly aligned with broader enterprise goals, your roadmap becomes a powerful tool for success.
Equip Product Teams with Tools Like IdeaPlan
To put these principles into practice, the right tools can make all the difference. Roadmapping platforms help centralize your data, ensuring everyone stays aligned on vision and priorities. They also make it easier to gather customer feedback at scale, automate performance tracking, and provide customized views for different stakeholders.
One such tool is IdeaPlan (https://www.ideaplan.io), which equips product leaders with AI-powered insights to scale their management efforts. By focusing on clear objectives, relevant KPIs, and regular iterations, and by using tools like IdeaPlan, you can create roadmaps that deliver measurable business impact. A well-structured roadmap, paired with the right infrastructure, transforms strategy into tangible results.
Explore More
- Metrics & Analytics for Director/VP Product Managers - Director and VP metrics: building analytics infrastructure, designing organizational KPIs, connecting product data to board-level reporting and...
- Top 10 Product Analytics Tools and Metrics (2026) - 10 analytics tools and key metrics every PM needs to track user behavior, measure feature impact, run experiments, and make data-driven product decisions.
- Top 10 Retention Metrics for SaaS Products (2026) - 10 retention metrics that reveal whether your SaaS product keeps users coming back.
- Top 12 SaaS Metrics Every PM Should Track (2026) - The 12 most important SaaS metrics for product managers.
Related Blog Posts
- Essential Product Management Checklist for 2025
- How to Build a Product Roadmap in 5 Simple Steps
- Align Product Roadmaps with Business Goals
- Outcome-Driven Leadership: Tips for Product Managers